Markdown visualizations
Markdown visualizations allow for a combination of Markdown elements and query variables. You can use it to create a visualization that includes text, images, links, data, iframes, and more.
Creating Markdown with AI
Section titled “Creating Markdown with AI”You can use the Query Helper to generate markdown visualizations based on natural language prompts. The AI will create rich, flexible data displays that combine HTML, CSS, Mustache template variables, and custom JustAsk components like <Sparkline> and <ChangeArrow>.
To create a Markdown visualization with AI:
Step 1
Create a query in a workbook.
Step 2
Open the Query Helper.
Step 3
Ask JustAsk Agent to create a custom layout (e.g., “Create a custom HTML layout for this data” or “Show this as a formatted text display with sparklines”)
Step 4
Review and refine the generated Markdown visualization as needed.
Once generated, you can continue to refine the visualization through the chat or manually edit it using the Markdown editor. To learn more about building visualizations with AI, refer to Generating visualizations with AI.
Using the Markdown editor
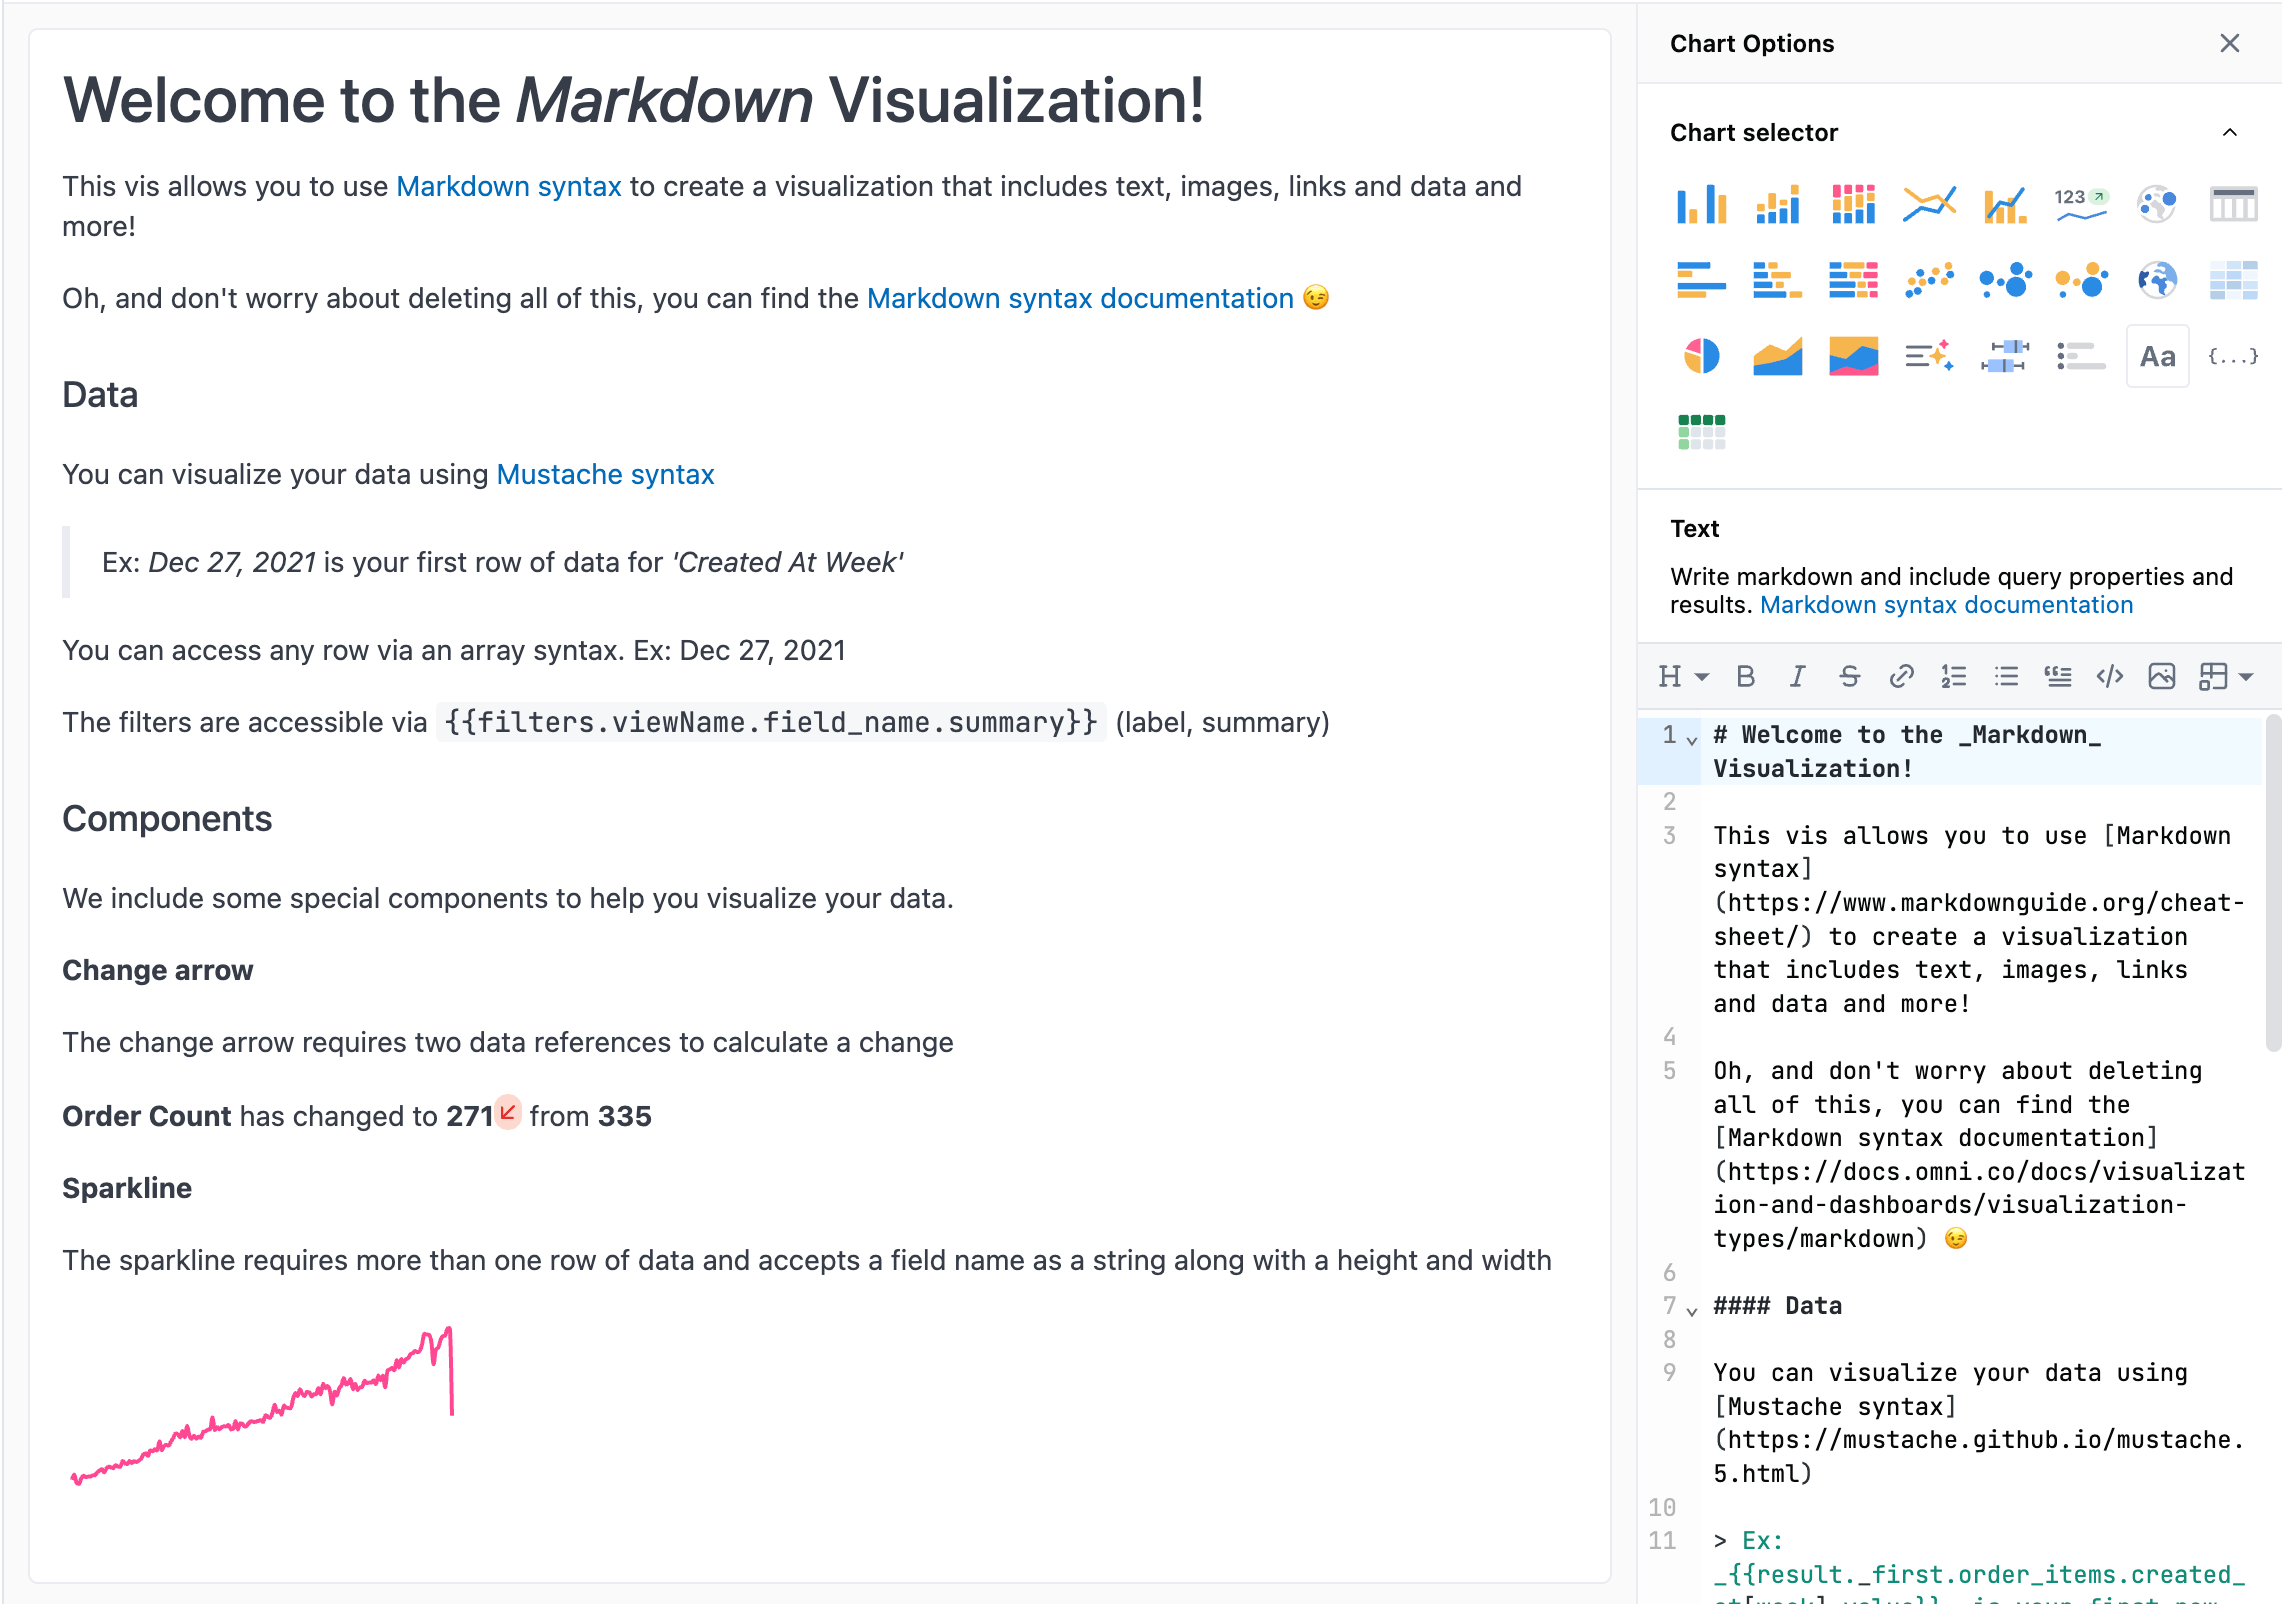
Section titled “Using the Markdown editor”When you select Markdown as the visualization type, a Markdown editor will display in the chart’s Options pane. As changes are made, the chart area will automatically update.
At the top of the editor is a toolbar to help you generate correct Markdown syntax for common formatting actions.
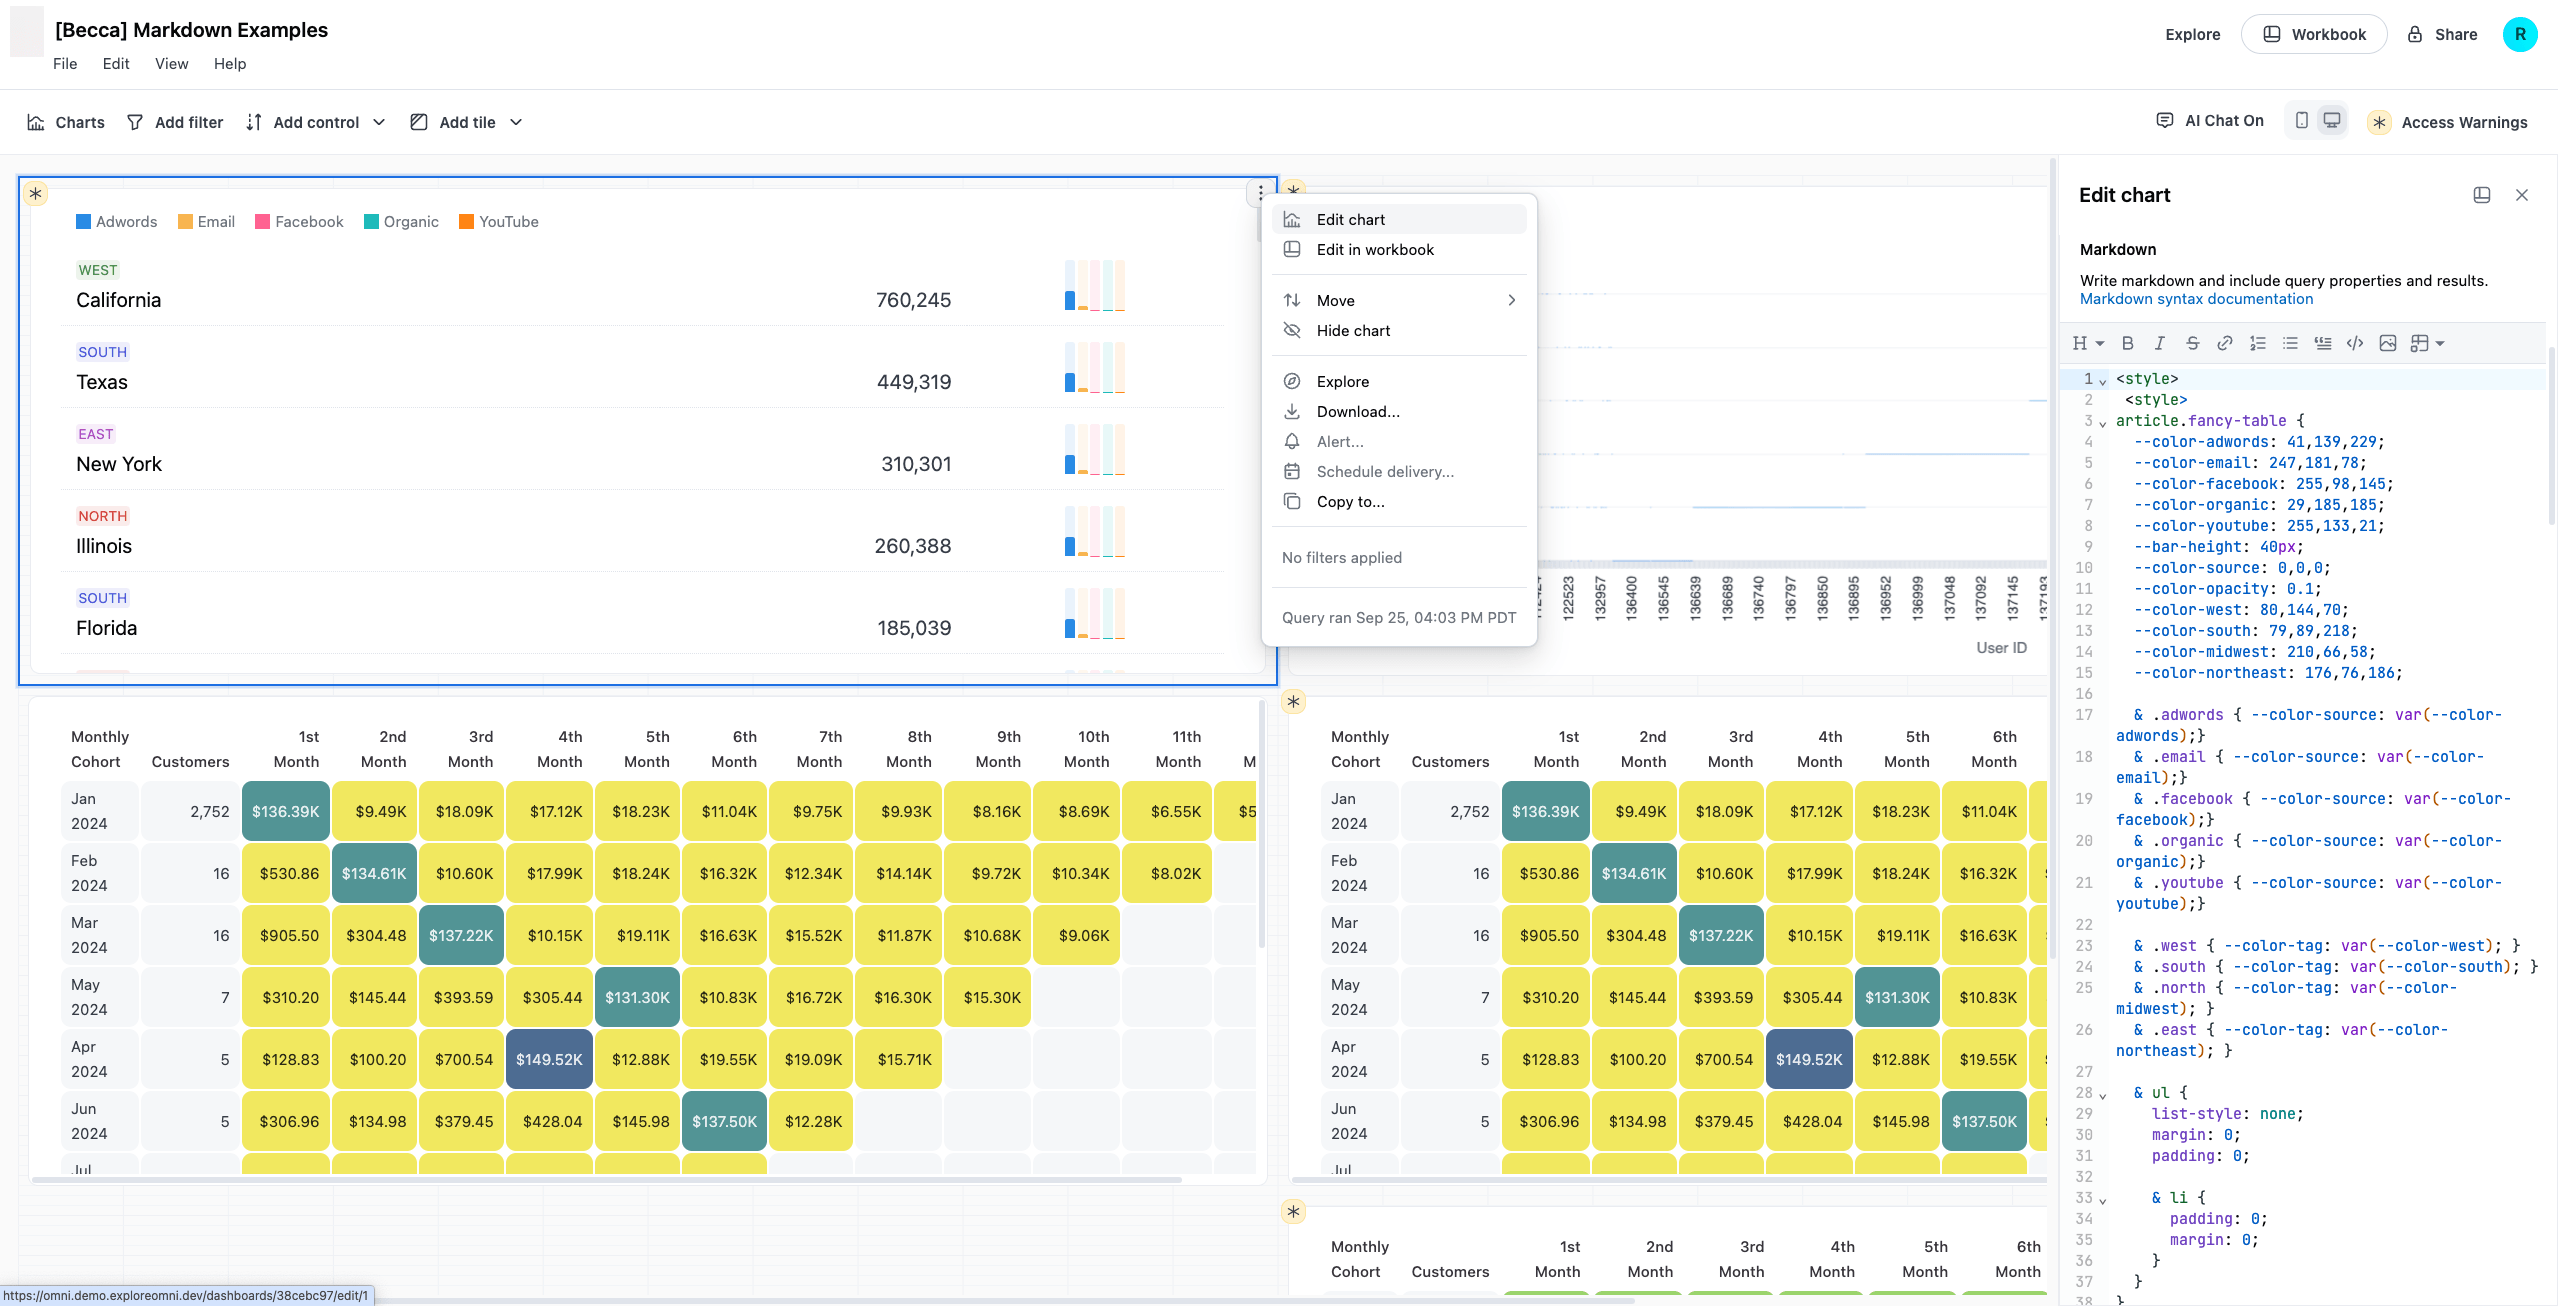
You can also access the Markdown editor in a draft dashboard by clicking the icon on a Markdown tile and selecting Edit in chart. The tile will update as you make changes in the editor.
Including HTML
Section titled “Including HTML”The Markdown editor interprets Markdown first and foremost. While it is possible to incorporate HTML, it helps to think of these more as text documents than true HTML files.
When formatting your code, keep the following in mind:
- Indentation is interpreted as a code block. Keep your code flush to the left to prevent unintended code blocks.
- Empty lines may cause odd behavior. In Markdown, these are paragraph indicators. This occurs because the
divis included in a code block as plain text, which will strand its closing tag.
Best practices
Section titled “Best practices”While you can use HTML, try to use it sparingly to simplify things. If you do need to use HTML elements:
- Use supported semantic HTML elements where possible, such as
articleorsection. Large numbers ofdivsin a row can cause parsing issues. - Limit the depth of
divnesting. Deeply nested elements increase the likelihood of conflicts between the Markdown and HTML parsing. - Use
<style></style>and CSS classes over inlinestyletags for custom CSS.
Limitations
Section titled “Limitations”- PDFs in deliveries and downloads may render differently than what’s visible in a browser,, including:
- Directly referencing native HTML tags - for example,
h3 { font-size: 18px; }may not always work - Some characters in CSS can’t be parsed causing those style declarations to be ignored, including:
- The quotation marks needed for
content: "<value>";will not work &.and&:notation in your CSS will be ignored. Do not use this syntax if you nest your CSS.
- The quotation marks needed for
- Directly referencing native HTML tags - for example,
- Invalid HTML or CSS syntax may not render correctly in PNGs or PDFs even if it correctly renders in a browser. For example,
@media
Dark mode styling
Section titled “Dark mode styling”When your JustAsk instance is in dark mode, the Markdown visualization automatically receives a prefers-dark class. You can use this class to apply different styles based on the theme.
To target elements in dark mode, use the &.prefers-dark selector in your CSS:
<style>  h1 {    color: red;  }
  .custom-element {    background: green;  }
  &.prefers-dark h1 {    color: blue;  }
  &.prefers-dark .custom-element {    background: yellow;  }</style>
In this example, h1 elements will be red in light mode and blue in dark mode. The custom-element class will have a green background in light mode and yellow in dark mode.
Referencing query elements
Section titled “Referencing query elements”Data and other elements from the query can be exposed using Mustache syntax. For example, {{query_element}}. The full list of query elements can be seen using {{ inspect }}.
To reference query elements, you can do any of the following:
Step 1
Use the Query details dropdown menu inside the Markdown editor.
Step 2
Click any cell in the results table to copy the Markdown syntax:
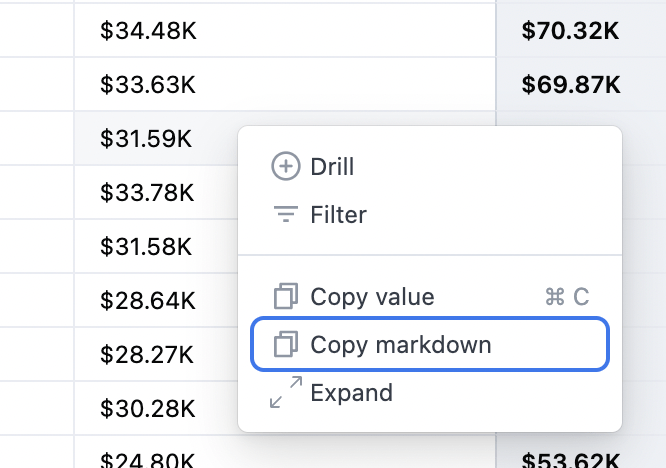
Step 3
Write the syntax directly, for example:
# Example field reference{{fields.blob_sales_view.total_sales_field.label}}
# Example filter reference{{filters.blob_sales_view.total_sales_field.value}}
Refer to the Markdown Mustache syntax reference for more information and examples.
Looping through the results set
Section titled “Looping through the results set”To iteratively generate Markdown tiles based on the results set, use {} and {{/result}} to create a loop. For example:
{} // start a loop{{<view_name>.<field_name>.value}} // access contents of that loop [...]{{<view_name_n>.<field_name_n>.value}} // reference more fields(<br>) // // maybe add a newline to create sections{{/result}} // end loopAdding visual components
Section titled “Adding visual components”Along with adding images and code to help highlight your data, you can also use the built-in components to create inline visualizations:
- Change arrow - Adds an arrow icon indicating the type of change between two data points
- Sparkline - Adds a sparkline. Useful for seeing the shape in variation in a condensed way.
More complex visualizations are possible.
Change arrow
Section titled “Change arrow”Adds an arrow icon indicating the type of change between two data points. If the change is a positive number, the arrow will be green. If negative, it will be red.
To use this component, your results must include two data points that can be used to calculate a change.
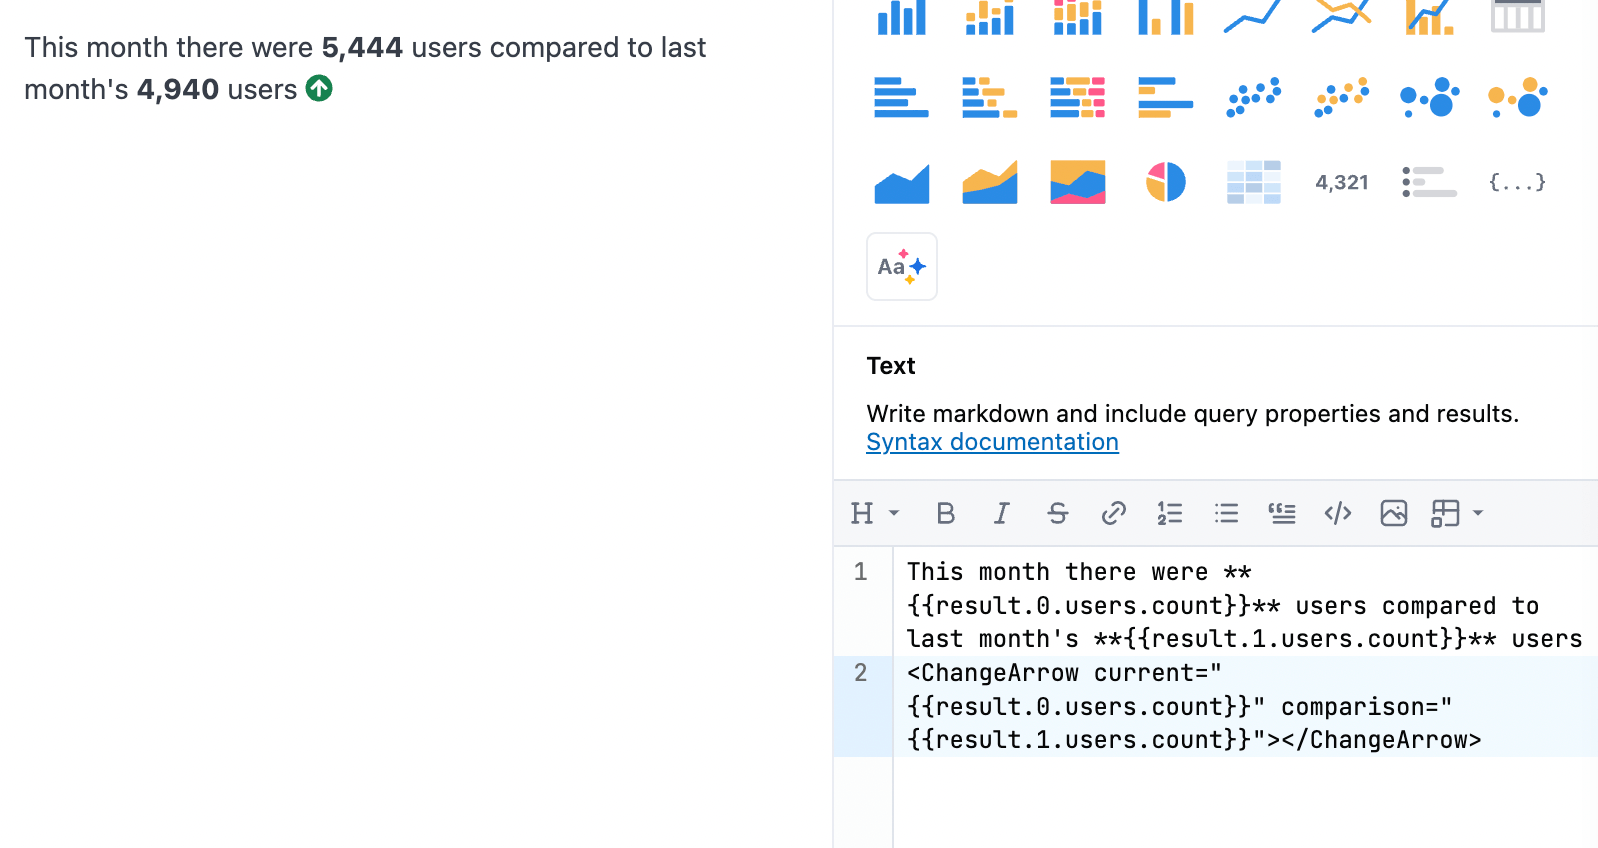
<ChangeArrow current="{{result.0.users.count.value_static}}" comparison="{{result.1.users.count.value_static}}"></ChangeArrow>Properties
Section titled “Properties”| Name | Value | Notes |
|---|---|---|
| current | result.0.view_name.field_name.value_static | Use value_static instead of value, since the value and not the drillable element is needed |
| comparison | result.1.view_name.field_name.value_static |
Sparkline
Section titled “Sparkline”Adds a sparkline. Useful for seeing the shape in variation in a condensed way.
To use this component, your results must have more than one row of data and a field name.
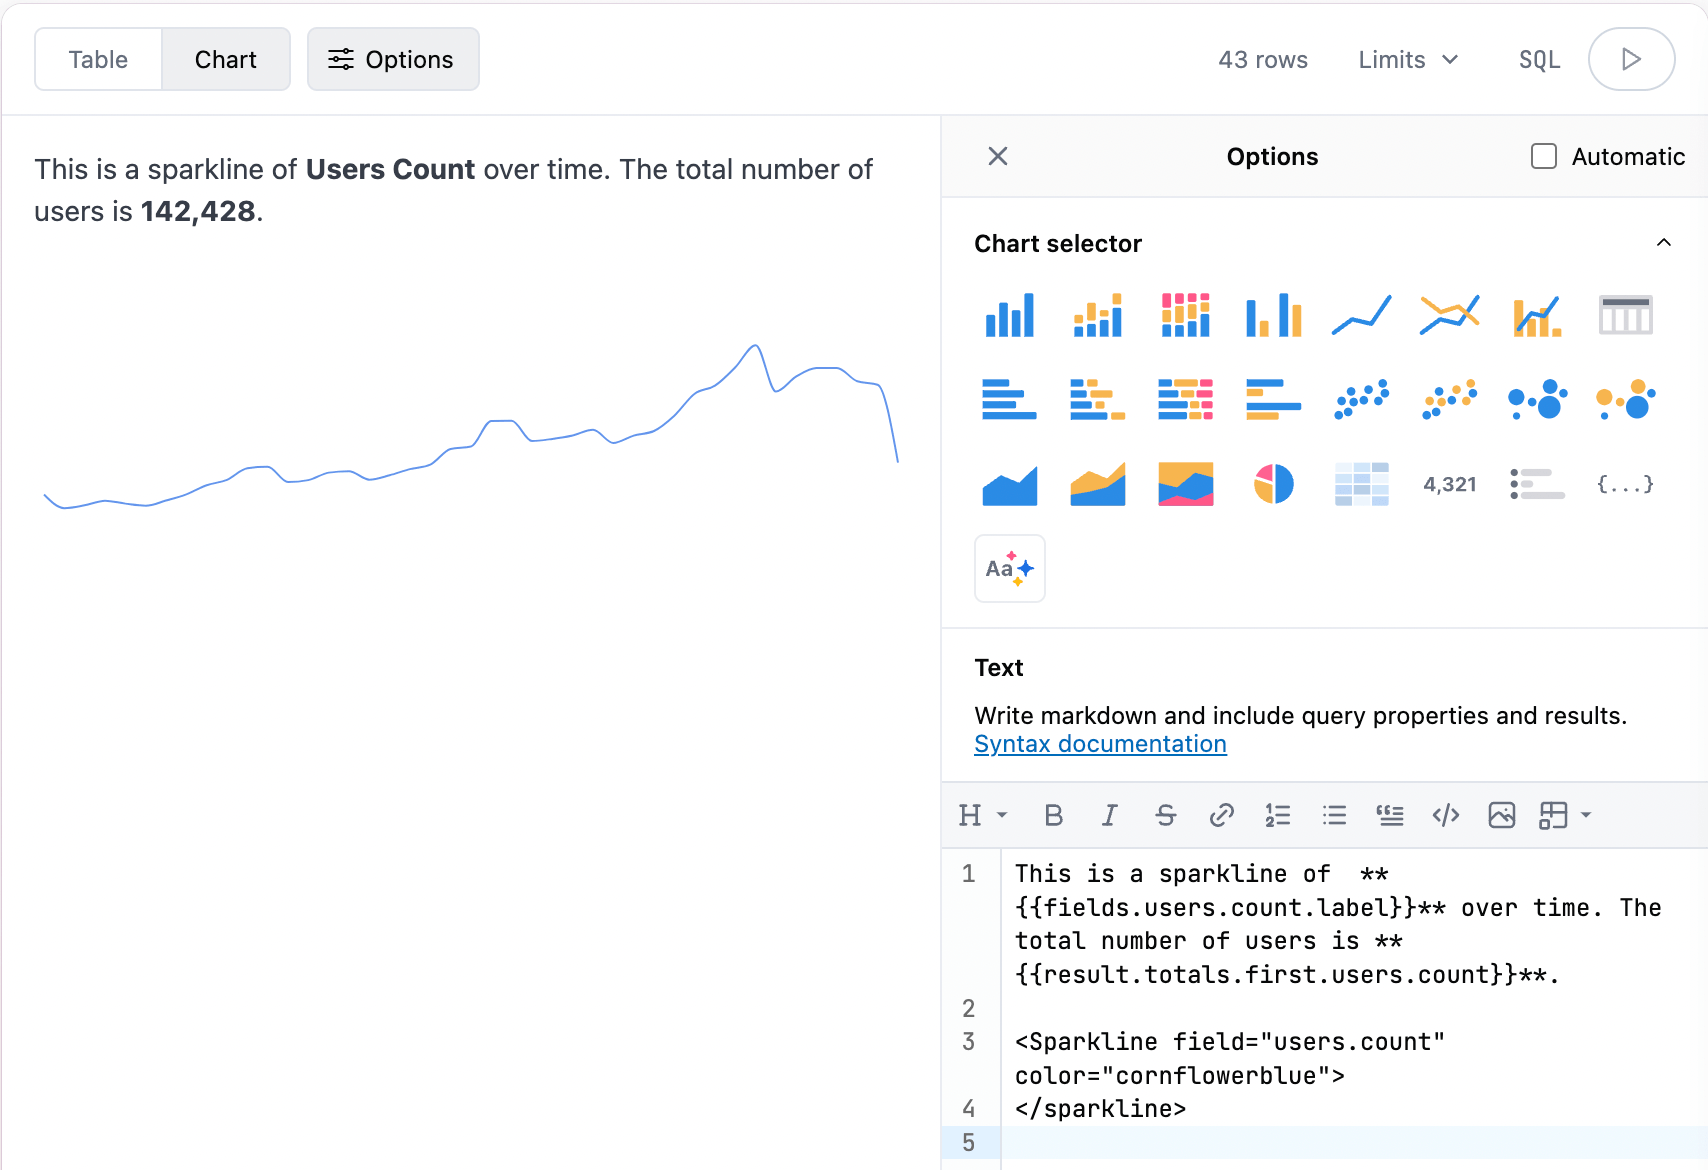
<Sparkline field="users.count" color="cornflowerblue"></Sparkline>Properties
Section titled “Properties”| Name | Value | Notes |
|---|---|---|
| color | CSS color, ex: cornflowerblue | |
| field | view_name.field_name | |
| height | Integer, ex: 4 | |
| width | Integer, ex: 4 | |
| reverse | true | Remove property for false |
| type | line (default) or bar |
Adding iframes
Section titled “Adding iframes”Using iframes in a Markdown visualization is also supported. iframes can be parameterized with query elements.
By default, JustAsk applies restrictions (sandboxing) when rendering iframes. This means that some website features, such as popups, may be unavailable or incompatible.
Use the dropdowns to check out some examples.
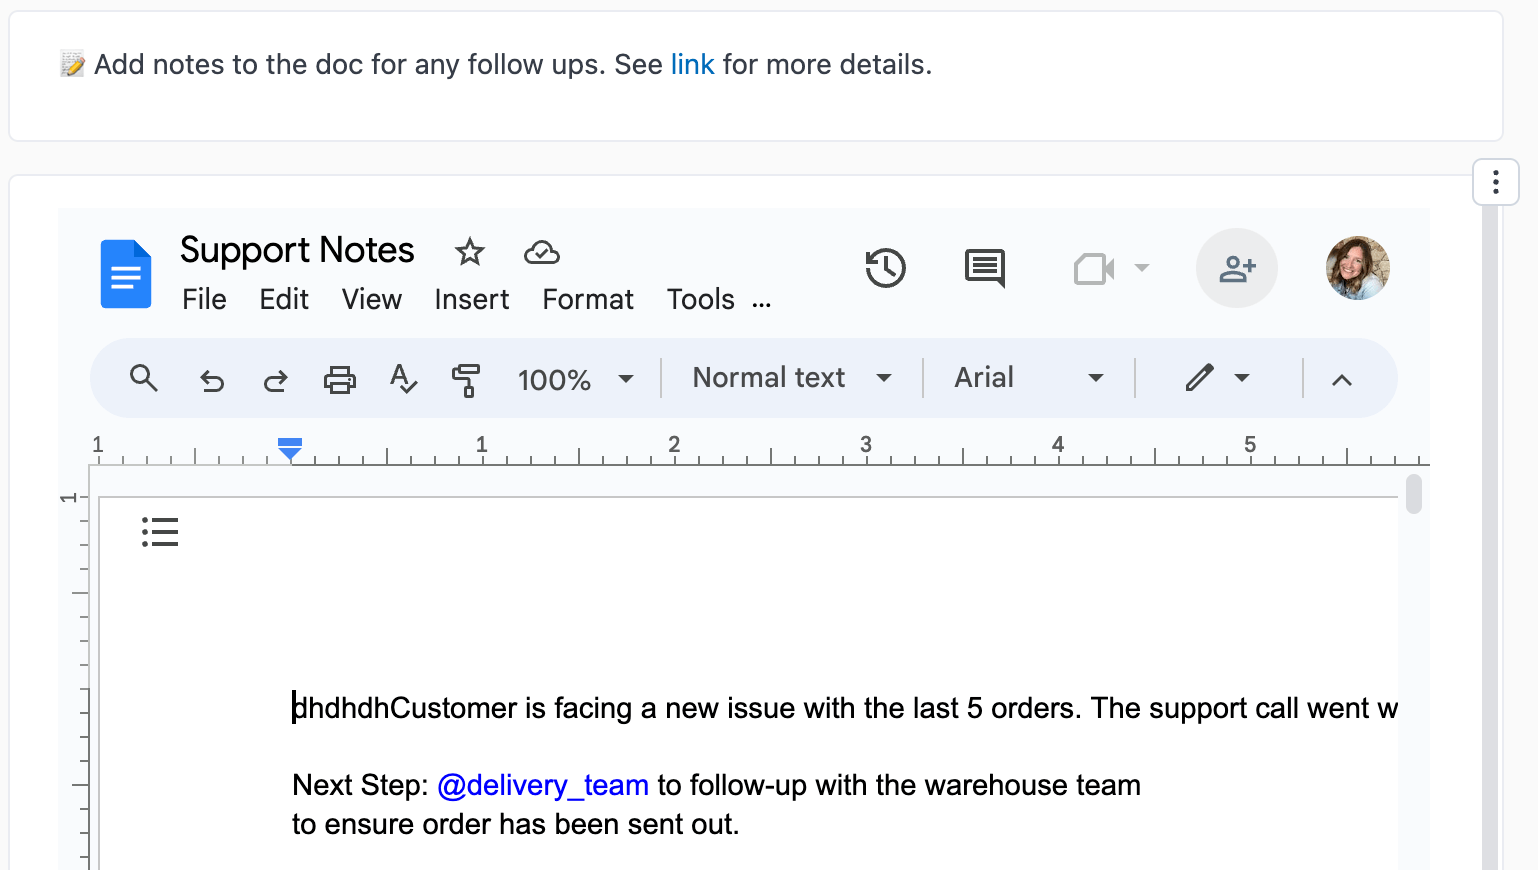
Google Docs
Code:
<iframe width="650" height="450" src="https://docs.google.com/document/d/id"></iframe>Result:
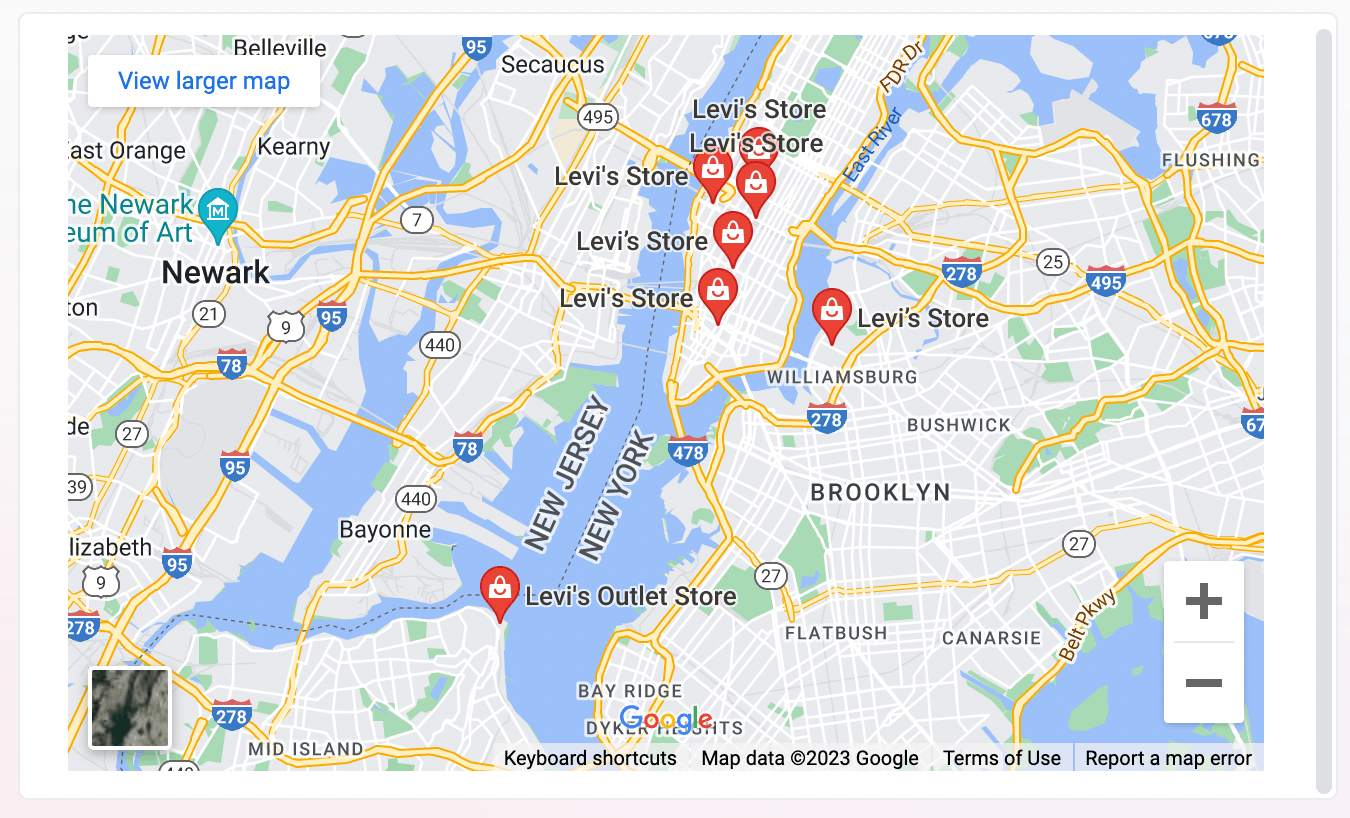
Google Maps
Code:
<iframe src="https://www.google.com/maps/embed/v1/search?q={{result.0.products.brand.value_static}}+in+{{result._first.users.city.value_static}},{{result._first.users.state.value_static}}&key=AIzaSyCXfF4zpXaYkgVaBzj3oZUtmcDAxpdoOGk&" width="100%" height="100%"></iframe>Result:
Twitter/X
Code:
<iframe height=250 width=550 src="https://twitframe.com/show?url=https%3A%2F%2Ftwitter.com%2Fjack%2Fstatus%2F20"></iframe>Result:
Windy
Code:
<iframe width="650" height="450" src="https://embed.windy.com/embed2.html?lat=39.018&lon=-77.539&detailLat=39.018&detailLon=-77.539&width=650&height=450&zoom=5&level=surface&overlay=wind&product=ecmwf&menu=&message=&marker=&calendar=now&pressure=&type=map&location=coordinates&detail=&metricWind=default&metricTemp=default&radarRange=-1"></iframe>Result:
YouTube
Code:
<iframe width="560" height="315" src="https://www.youtube.com/embed/lNAzOJrV-Zk" title="YouTube video player"></iframe>Result: