Building point-and-click queries
Selecting fields
Section titled “Selecting fields”Dimensions and measures are divided into separate sections in the field picker, each nested under individual tables in your data warehouse.
- A dimension is a grouping in your query (date, location, type, etc).
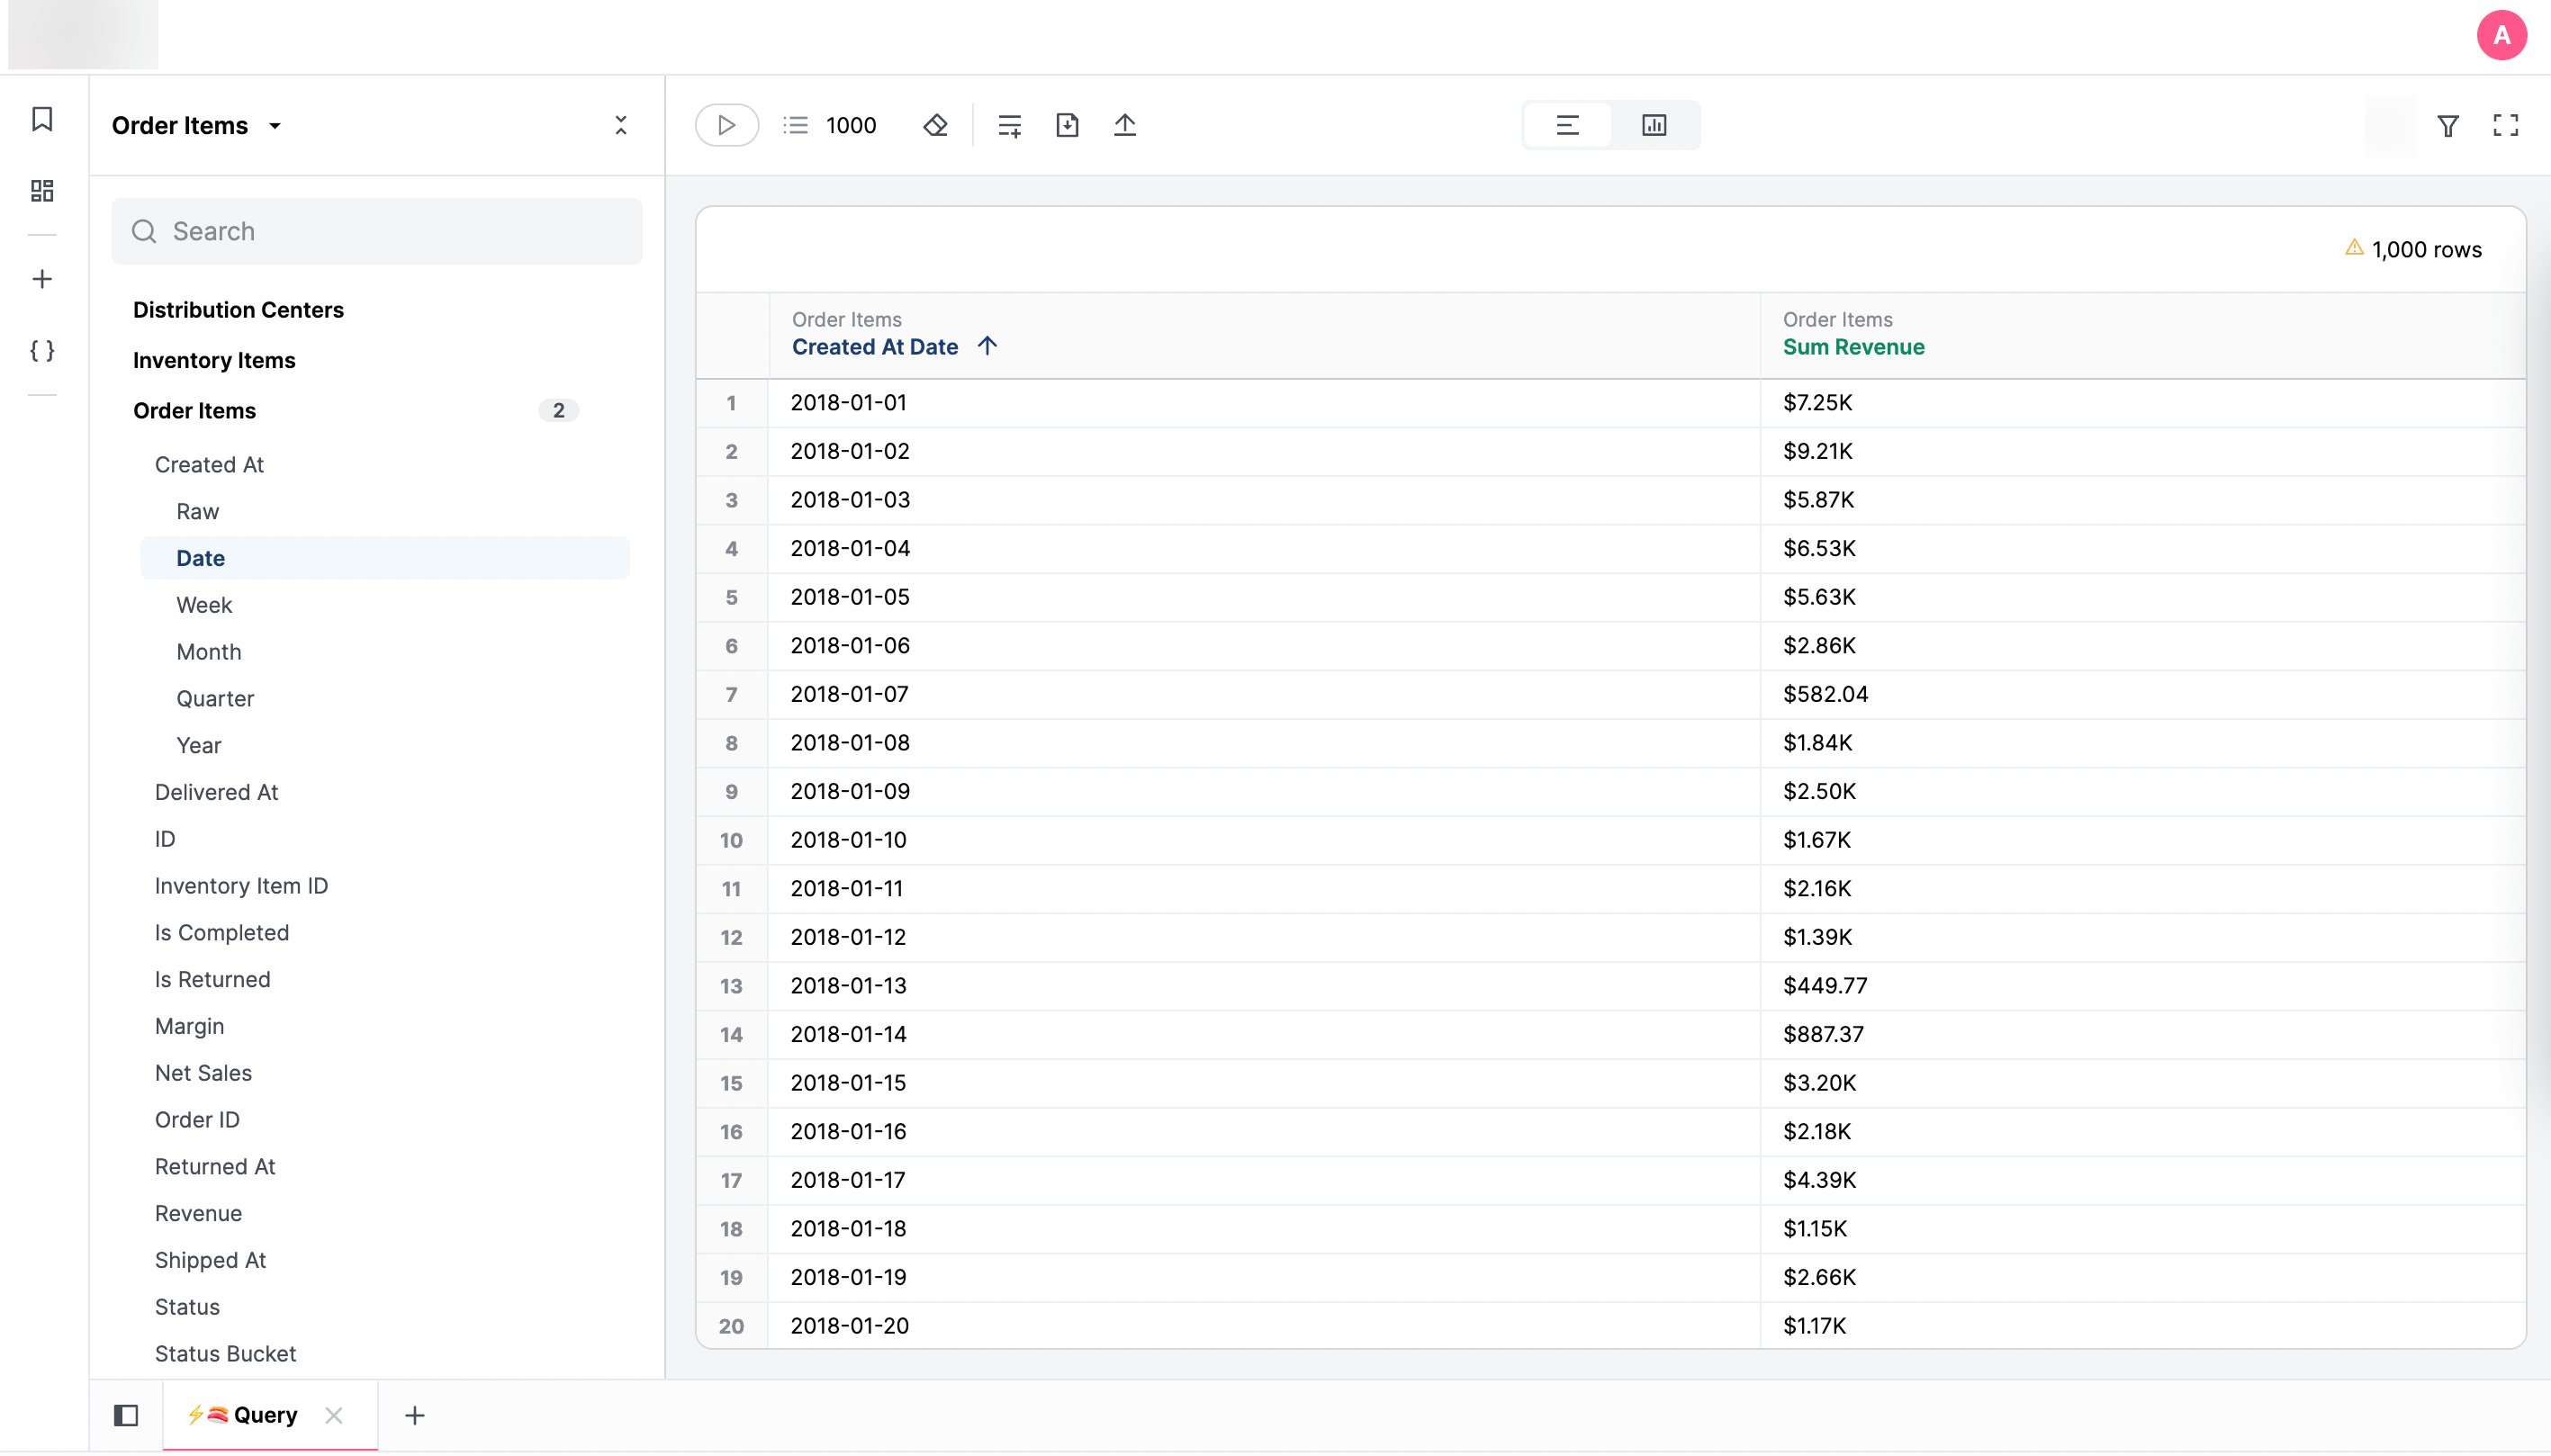
- A measure is an aggregation over your dimensions (sum, count, average, etc). For example, to query total revenue per day you would select a date dimension (
order_items.created_date) and a revenue measure (order_items.sum_revenue).
Here’s an example of what that would look like:
There are several advanced actions available on field selection using right click, or hovering over the field and clicking the icon.
Identifying workbook-only fields
Section titled “Identifying workbook-only fields”Fields created in a workbook — such as custom fields and calculated fields — are not part of the shared model. To help you distinguish these from shared model fields, JustAsk displays a small yellow badge called a field verification indicator next to their data type icon:
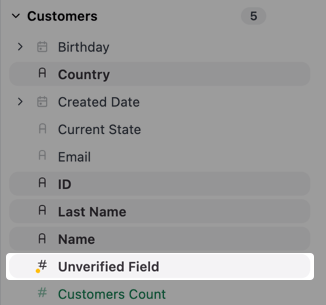
These are field verification indicators, intended to help you understand which fields in the workbook are from the shared model and which are fields created specifically in the workbook. Fields without an indicator are from the shared model.
When the Verification setting is enabled, verification indicators appear in several locations throughout workbooks:
- Field browser - Next to unverified fields when selecting fields to add to your query
- Data table column headers - In the column headers of your results table
- Visualization configurations - Within the series editor, table configuration, and available fields lists
Searching fields
Section titled “Searching fields”Fields can be searched with the input box above the field picker. Default search will look at fields and views. However, you can specify additional conditions using these filter options:
- In-use - Limits results based on field usage. By default, all fields display regardless of whether they’re used in the query. Click the dropdown arrow to choose between:
- Fields in-use - Shows only fields that are selected or filtered in the current query
- Views in-use - Shows all fields from views that have any in-use fields, useful for discovering related fields in the same view
- Field type - Limits the results to selected data types, such as
boolean,number, etc.) - Topic - Limits the results to fields in selected topics
- Label - Limits results to fields with or without labels
- Descriptions - Limits results to fields with or without descriptions
Additional operators
Section titled “Additional operators”The search box also supports operators that allow for additional querying options. For example, to limit the field type to date fields, you’d enter data_type:date.
| Operator | Description | Example |
|---|---|---|
data_type: | Filters fields based on data type: date, string, boolean, interval, array, json, number | data_type:date |
is: | Filters fields based on whether the field is a dimension, measure, or hidden | is:dimension |
model_type: | Filters fields based on the model type: schema, shared, branch, workbook, query | model_type:schema |
schema: | Filters fields based the schema that contains them | schema:marketing |
tag: | Filters fields based on the provided tag | tag:secure |
Filtering
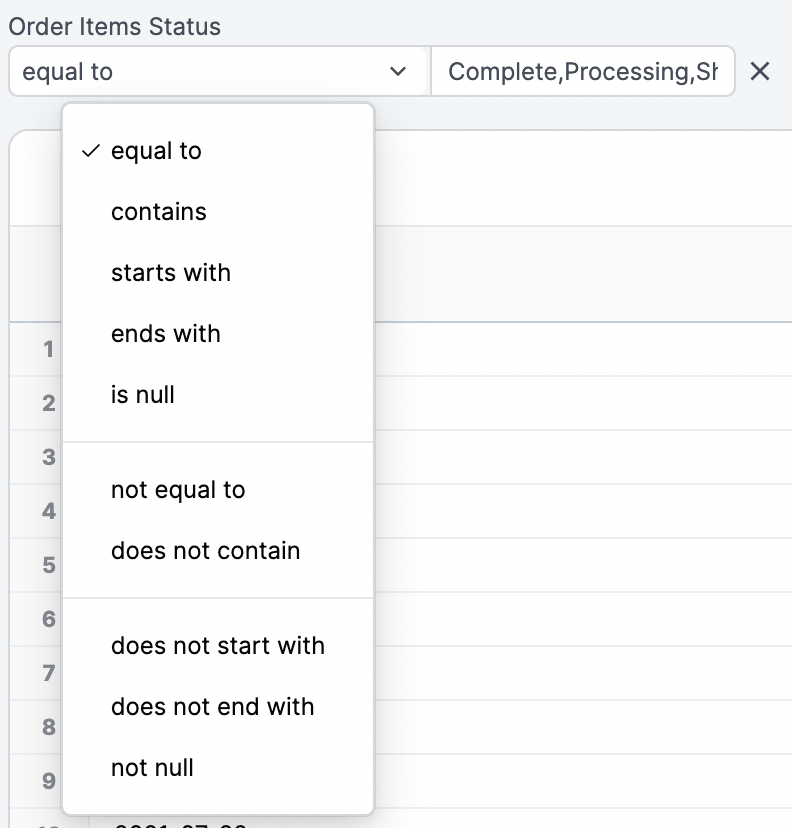
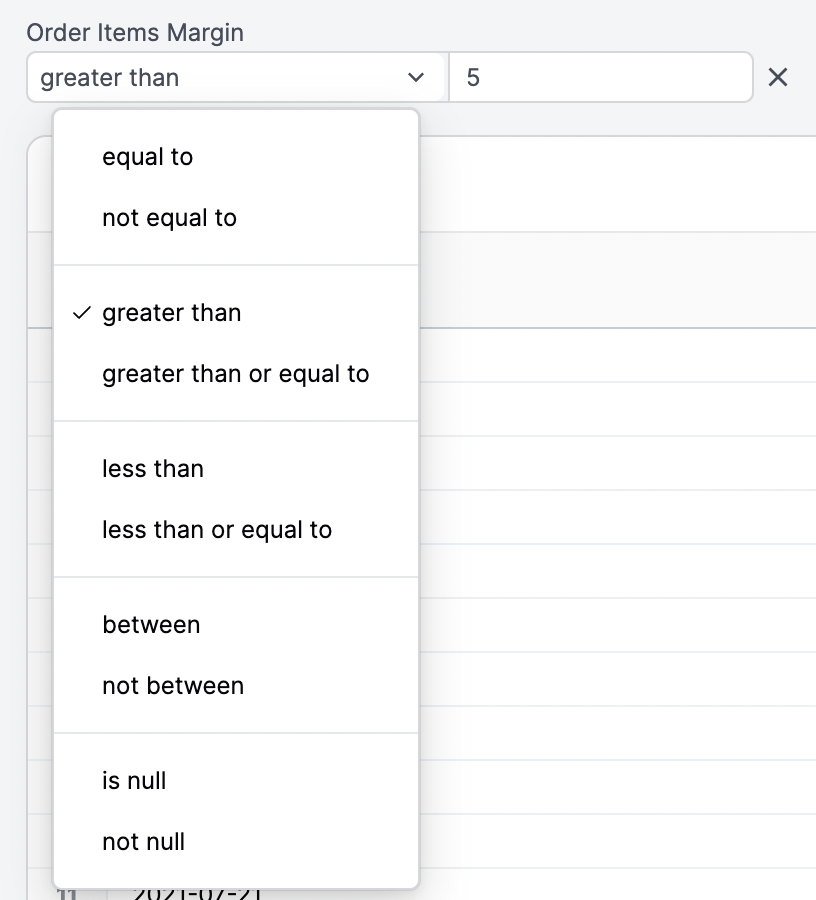
Section titled “Filtering”Each dimension can be added as a filter to focus on specific rows of data. Different filtering options will be presented for dates, numbers, and strings:
To filter using more than one value (equivalent to using OR), insert a comma between values: [bread, cheese]. If your filter values include commas, you can escape them with \: San Francisco\, CA.
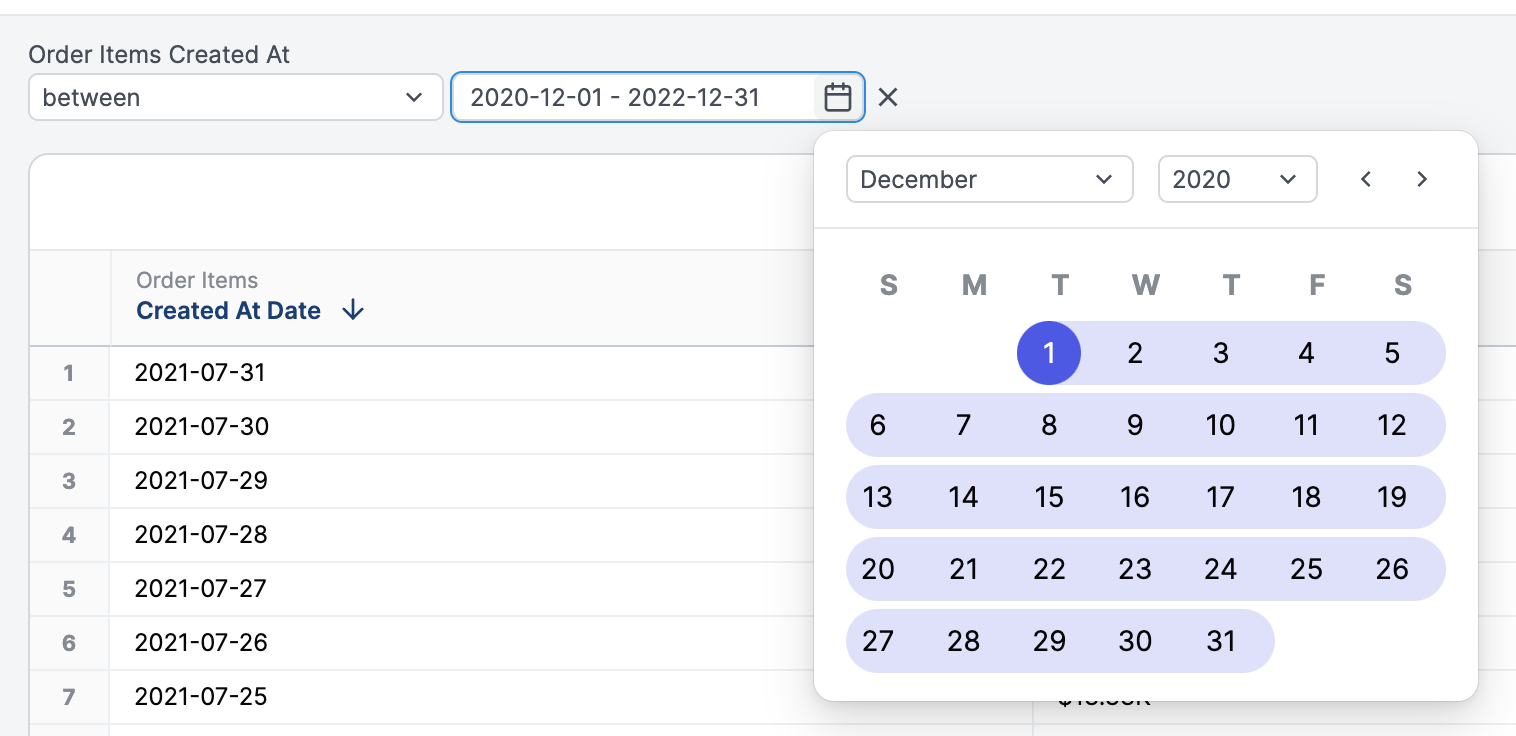
Date filters
Section titled “Date filters”Date filtering offers several filter options, including:
- Absolute date filtering, such as
2022,2023-01-01,2021-Q4 - Relative date filtering, such as
after 7 complete days ago,1 year ago
At times, filtering may require using both absolute and relative dates, for example first ten days of 2023 or 100 days ago for 10 days. For these situations, time for an interval duration offers more flexible time inputs:
- The first input should contain the starting point. This value should either be a date (
2023-01-01) or a relative date (10 days ago). Note:Agois required. - The second input should contain the duration.
Check out the following examples to see how it all comes together:
# First ten days of 2023[2023][10 days]
# 100 days ago for 10 days[100 complete days ago][10 days]
# 1 hour ago for 2000 milliseconds[1 hour ago][2000 milliseconds]
Interval timeframe units
Section titled “Interval timeframe units”Intervals can accept any timeframe unit:
| Interval type | Supported units |
|---|---|
| day | day, days, complete day, complete days |
| week | week, weeks, complete week, complete weeks |
| month | month, months, complete month, complete months |
| quarter | quarter, quarters, complete quarter, complete quarters |
| year | year, years, complete year, complete years |
| millisecond | millisecond, milliseconds, complete millisecond, complete milliseconds |
| second | second, seconds, complete second, complete seconds |
| minute | minutes, complete minute, complete minutes |
| hour | hour, hours, complete hour, complete hours |
Advanced filtering options
Section titled “Advanced filtering options”Filtering by another query
Section titled “Filtering by another query”With two or more tabs, one tab, or query, can be used as a filter in other queries. This is particularly useful for creating a dynamic subset of information in one query and a deep dive into the results on another tab.
For example, you want to understand the brands your top customers are purchasing. To do this, you would:
-
In a workbook, create a tab with the definition of a top customer.
-
Create a new tab.
-
In the new tab, add the dimensions and measures you want to analyze.
-
In the field picker, locate a dimension used in the top customer definition tab.
-
On the dimension, click the options menu (three dots) and select Filter.
-
Select Is from another query.
-
In the modal that displays, select the tab and dimension you want to filter by:
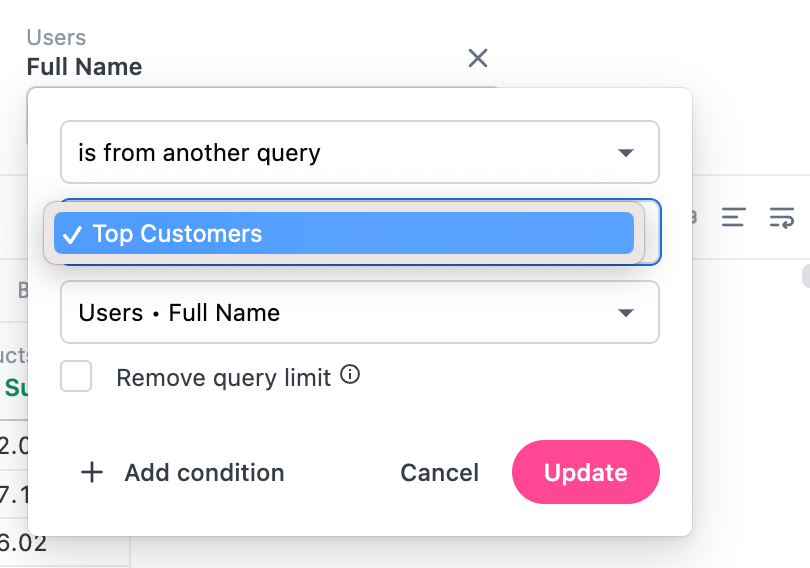
This will filter the tab results by the selected subset. In SQL, this generates WHERE clauses that look like WHERE IN (SELECT...) where the SELECT clause is the filtering query.
You can also use this approach to filter out data. To do this, select Is not from another query in the Filter menu.
Filtering by multiple conditions
Section titled “Filtering by multiple conditions”You can filter a field by multiple conditions (e.g. Date is in the past 30 days OR date is null) by clicking Add Condition in the filter modal. Then, select if you want All or Any of the conditions to apply to the query.
Filter Suggestions
Section titled “Filter Suggestions”Filter suggestions are populated by running a sql query to return unique values for the field being filtered on, in the context of the Topic it is in.
The general format is:
SELECT field_filter_is_based_onFROM tableGROUP BY 1LIMIT 2000Depending on the specifics of the model (such as if this field is in a table other than the base view of a Topic) you may see the relevant JOIN or WHERE clause statements in the suggestion query.
The limit of 2000 is not configurable.
Refreshing filter suggestions
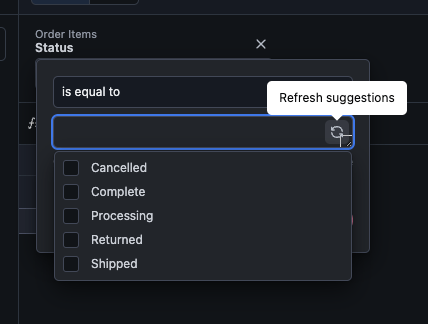
Section titled “Refreshing filter suggestions”In rare circumstances, filter suggestions may be cached in a stale state. To enable the refresh option:
- Mac - Hold
Command + Shift - Windows - Hold
Windows + Shift
Note: The refresh option only clears suggestions for the specific query, not all filter suggestions.
Pivoting
Section titled “Pivoting”Quickly build pivot tables by right-clicking any field in the field picker and selecting the Pivot option.
Flattening and filtered measures
Section titled “Flattening and filtered measures”You can also flatten the pivot and create filtered measures by clicking the actions menu (three dots) on a column and selecting Flatten pivot. When using this feature you can also choose to create an Other bucket on the fly:
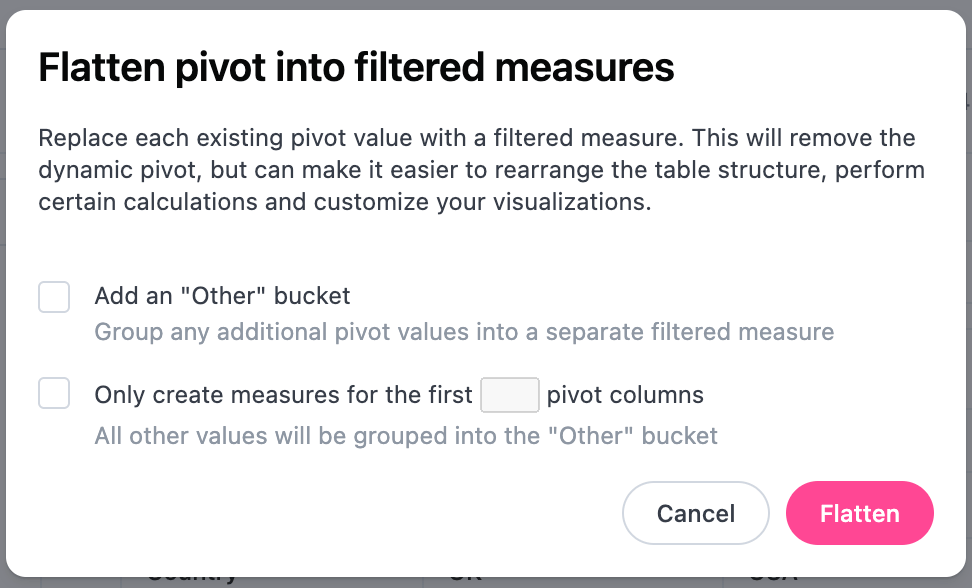
The new filtered measures will appear under the query fields and the field that was originally pivoted on will no longer be selected as a field that is in-use.
Creating custom fields
Section titled “Creating custom fields”Custom fields can be created through the right click menu or using the + button in the field picker. Refer to the Custom fields guide for more information.
Applying quick aggregates and timeframes
Section titled “Applying quick aggregates and timeframes”JustAsk provides a number of aggregations you can apply to fields right from the UI. In the field picker, right click on a field and select Aggregates. Date fields will have an additional Timeframes option.
| Field type | Dimensions (Timeframes) | Measures (Aggregates) |
|---|---|---|
| Dates |
|
|
| Strings | None |
|
| Numbers | None |
|
| Booleans | None |
|
Limiting and paginating rows in results
Section titled “Limiting and paginating rows in results”By default, queries are filtered to 1000 rows of data, but the limit can be adjusted dynamically up to 50,000 rows and paginated to see all result rows directly in JustAsk.
Row limits don’t impact the rows processed, only the rows available in the JustAsk UI. This setting is also used to paginate the results table. For example, if set to 5, the results table will display five rows at a time.
Column and pivot limits
Section titled “Column and pivot limits”JustAsk currently supports any number of measures in the results table. Pivots are limited to 200 columns.
Sorting
Section titled “Sorting”Data in the results table can be sorted on a column by column basis, with a cycle through descending, ascending, and unsorted. For sorting over more than one field (secondary sort or double sort), simply sort the first field and hold down shift for subsequent sort actions.
Interacting with tables
Section titled “Interacting with tables”Workbook results tables support spreadsheet-style selection, copying, editing, and cell interaction.
Selecting cells
Section titled “Selecting cells”- Click a cell to select it
- Click and drag across cells to select a rectangular region
- Shift+click a cell to select a range from the anchor to the clicked cell
- Click a row number to select an entire row. Combine with Shift to extend the selection.
- Click a column header to select an entire column. Combine with Shift to extend the selection.
- Click outside the table to clear the selection
Copying cells
Section titled “Copying cells”Select one or more cells, then copy them to your clipboard. Copied data uses a tab-separated format, so pasting into Excel or Google Sheets automatically places values into the correct cells. Column headers are included when all cells are selected.
Editing cells
Section titled “Editing cells”- Press Enter on a calculation cell to enter edit mode, or on other cells to expand the cell value
- Double-click a calculation cell to enter edit mode
- Right-click a cell to open the context menu with options to drill, filter, copy, or expand
Reordering columns
Section titled “Reordering columns”Drag a column header to reorder columns. Column reordering is not available in pivot tables.
Editing calculations
Section titled “Editing calculations”When editing a calculation in a table cell:
- Press Enter to save the calculation
- Press Escape to cancel and exit the editor
- Shift+click a cell to insert a cell range reference into the formula
Dashboard tables are read-only. For dashboard table interactions, see Interacting with table tiles.
Formatting number and date columns
Section titled “Formatting number and date columns”You can quickly format columns in your results table using the quick formatting menu. This menu provides curated format presets based on the selected field’s type, making it easy to apply common number and date formats.
To access the formatting menu:
- In the results table, click a column header to select the column
- Click the icon in the format bar above the table
The menu displays format options appropriate for the selected field type.
Number field formats
Section titled “Number field formats”For number fields, the format menu includes:
- Automatic - Uses the field’s default format
- Number - Standard number format
- Percent - Percentage format
- Currency/Accounting/Financial - Currency formats matched to your locale (for example, UK locale shows GBP options)
Date field formats
Section titled “Date field formats”For date fields, the format menu shows curated formats based on the field’s date grain:
- DATE and WEEK fields - Day-level formats such as
Mar 17, 2022,2022-03-17, andRelative (3 days ago) - MONTH fields - Month-level formats such as
March 2022,Mar 2022, and2022-03 - QUARTER fields - Quarter-level formats such as
Q1 2022
All date format options include Automatic to use the field’s default format.
Advanced date formatting
Section titled “Advanced date formatting”The format menu provides quick access to commonly used formats. For advanced date formatting options, open the Edit field panel by:
- Using the column header in the results table - Hover over the header, click the icon, then click Modeling > Edit.
- Using the field browser - Hover over the field, click the icon, then Edit.
Results table options
Section titled “Results table options”Clicking the Options button while viewing a workbook’s results allows you to a number of things:
-
Column Width - Allows you to automatically or manually set column width
-
Header Text - Allows you to control how column headers are displayed: clipped or wrapped to the next line
-
View Names - When enabled, the name of the view the column belongs to will display above the column header
-
Column Totals - When enabled, totals for each column (measure) will display at the bottom of the table. Refer to the Column totals section for more information.
-
Row Totals - Applicable to pivot tables. When enabled, totals for each row will display at the far right of the table. Refer to the Row totals section for more information.
-
Swap Rows And Columns - When enabled, table rows and columns will be transposed. This is useful when measures are needed across rows. Note: Some features, such as column sort, must be set prior to enabling this feature.
-
Group Measures in Pivot - Applicable to pivot tables. When enabled, measures in a pivot table will be grouped together. Open the toggle below for an example.
Grouped measures in pivot example
Let’s say you have the following table, which is pivoted using
Status:Status Processing Processing Completed Processing Total Sales Order Items Total Sales Order Items 44,562.32 564 100,892.61 2,654 If Group Measures in Pivot is enabled, the table would become this:
Status Processing Completed Total Sales Order Items Total Sales Order Items 44,562.32 564 100,892.61 2,654
Column totals
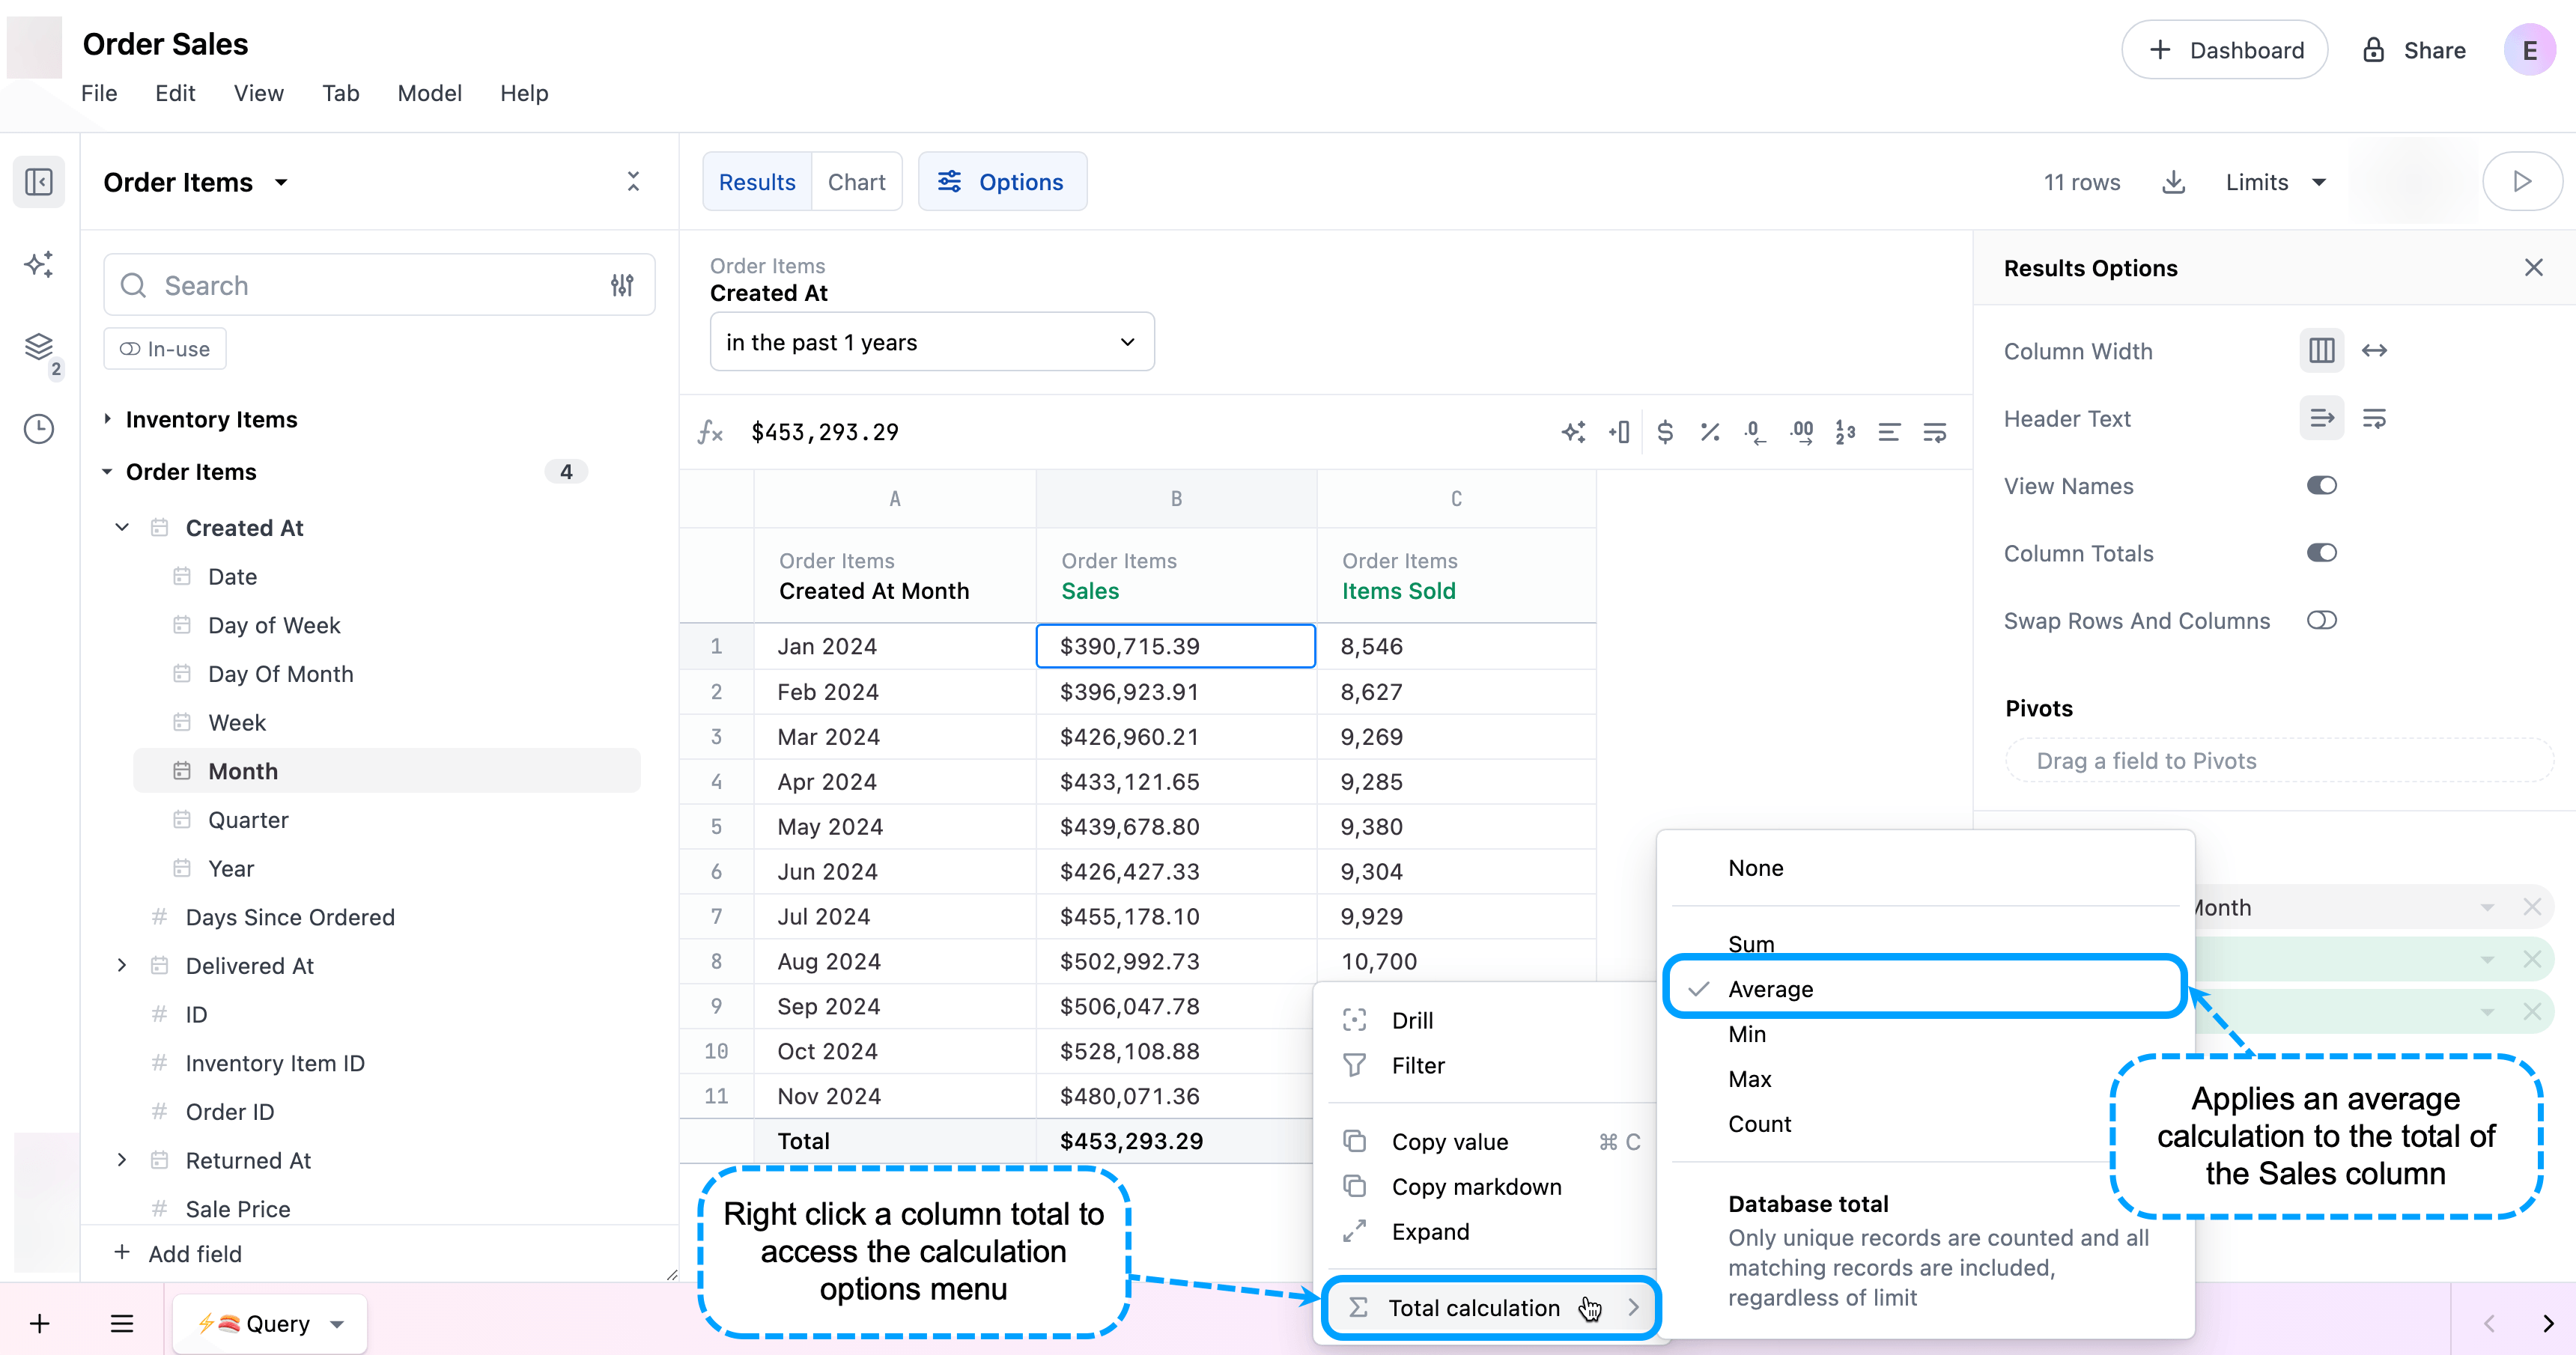
Section titled “Column totals”Enabling column totals adds a Total row at the bottom of the table. From here, you can right click on a measure’s total and select Total calculation to customize how the total is calculated.
For example, you have a table that shows total sales by month for 2024. If you wanted to see the average sales across all months, you could change the Total calculation to Average:
Dimension column totals
Section titled “Dimension column totals”By default, dimensions - such as dates or IDs - won’t have a Total value. However, you can still apply one by clicking the column total and using the Total calculation menu.
Calculation column totals
Section titled “Calculation column totals”Columns with calculations applied can also have custom totals. When column totals are enabled, JustAsk will default to using the column’s calculation as the initial total. Take the following table as an example, where the AVG Item Price and CONCAT Average Item Text columns use Excel-like formulas:
| Date | Order Total | Order Items | AVG Item Price | CONCAT Average Item Text |
|---|---|---|---|---|
| Jan 2024 | $50.00 | 2 | $25.00 | Average item price is $25.00 |
| Feb 2024 | $100.00 | 3 | $33.33 | Average item price is $33.33 |
| Mar 2024 | $72.00 | 6 | $12.00 | Average item price is $12.00 |
| Totals | $222.00 | 11 | $23.44 | Average item price is $23.44 |
In this example:
- The AVG Item Price column has a formula of
Order Total / Order Items. Using this formula, the column total is$23.44, which is the average of all the values in the column. - The CONCAT Average Item Text column has a formula of
CONCAT("Average item price is ", AVG Item Price). Using this formula, the column total value isAverage item price is $23.44, which uses the column total for the AVG Item Price column.
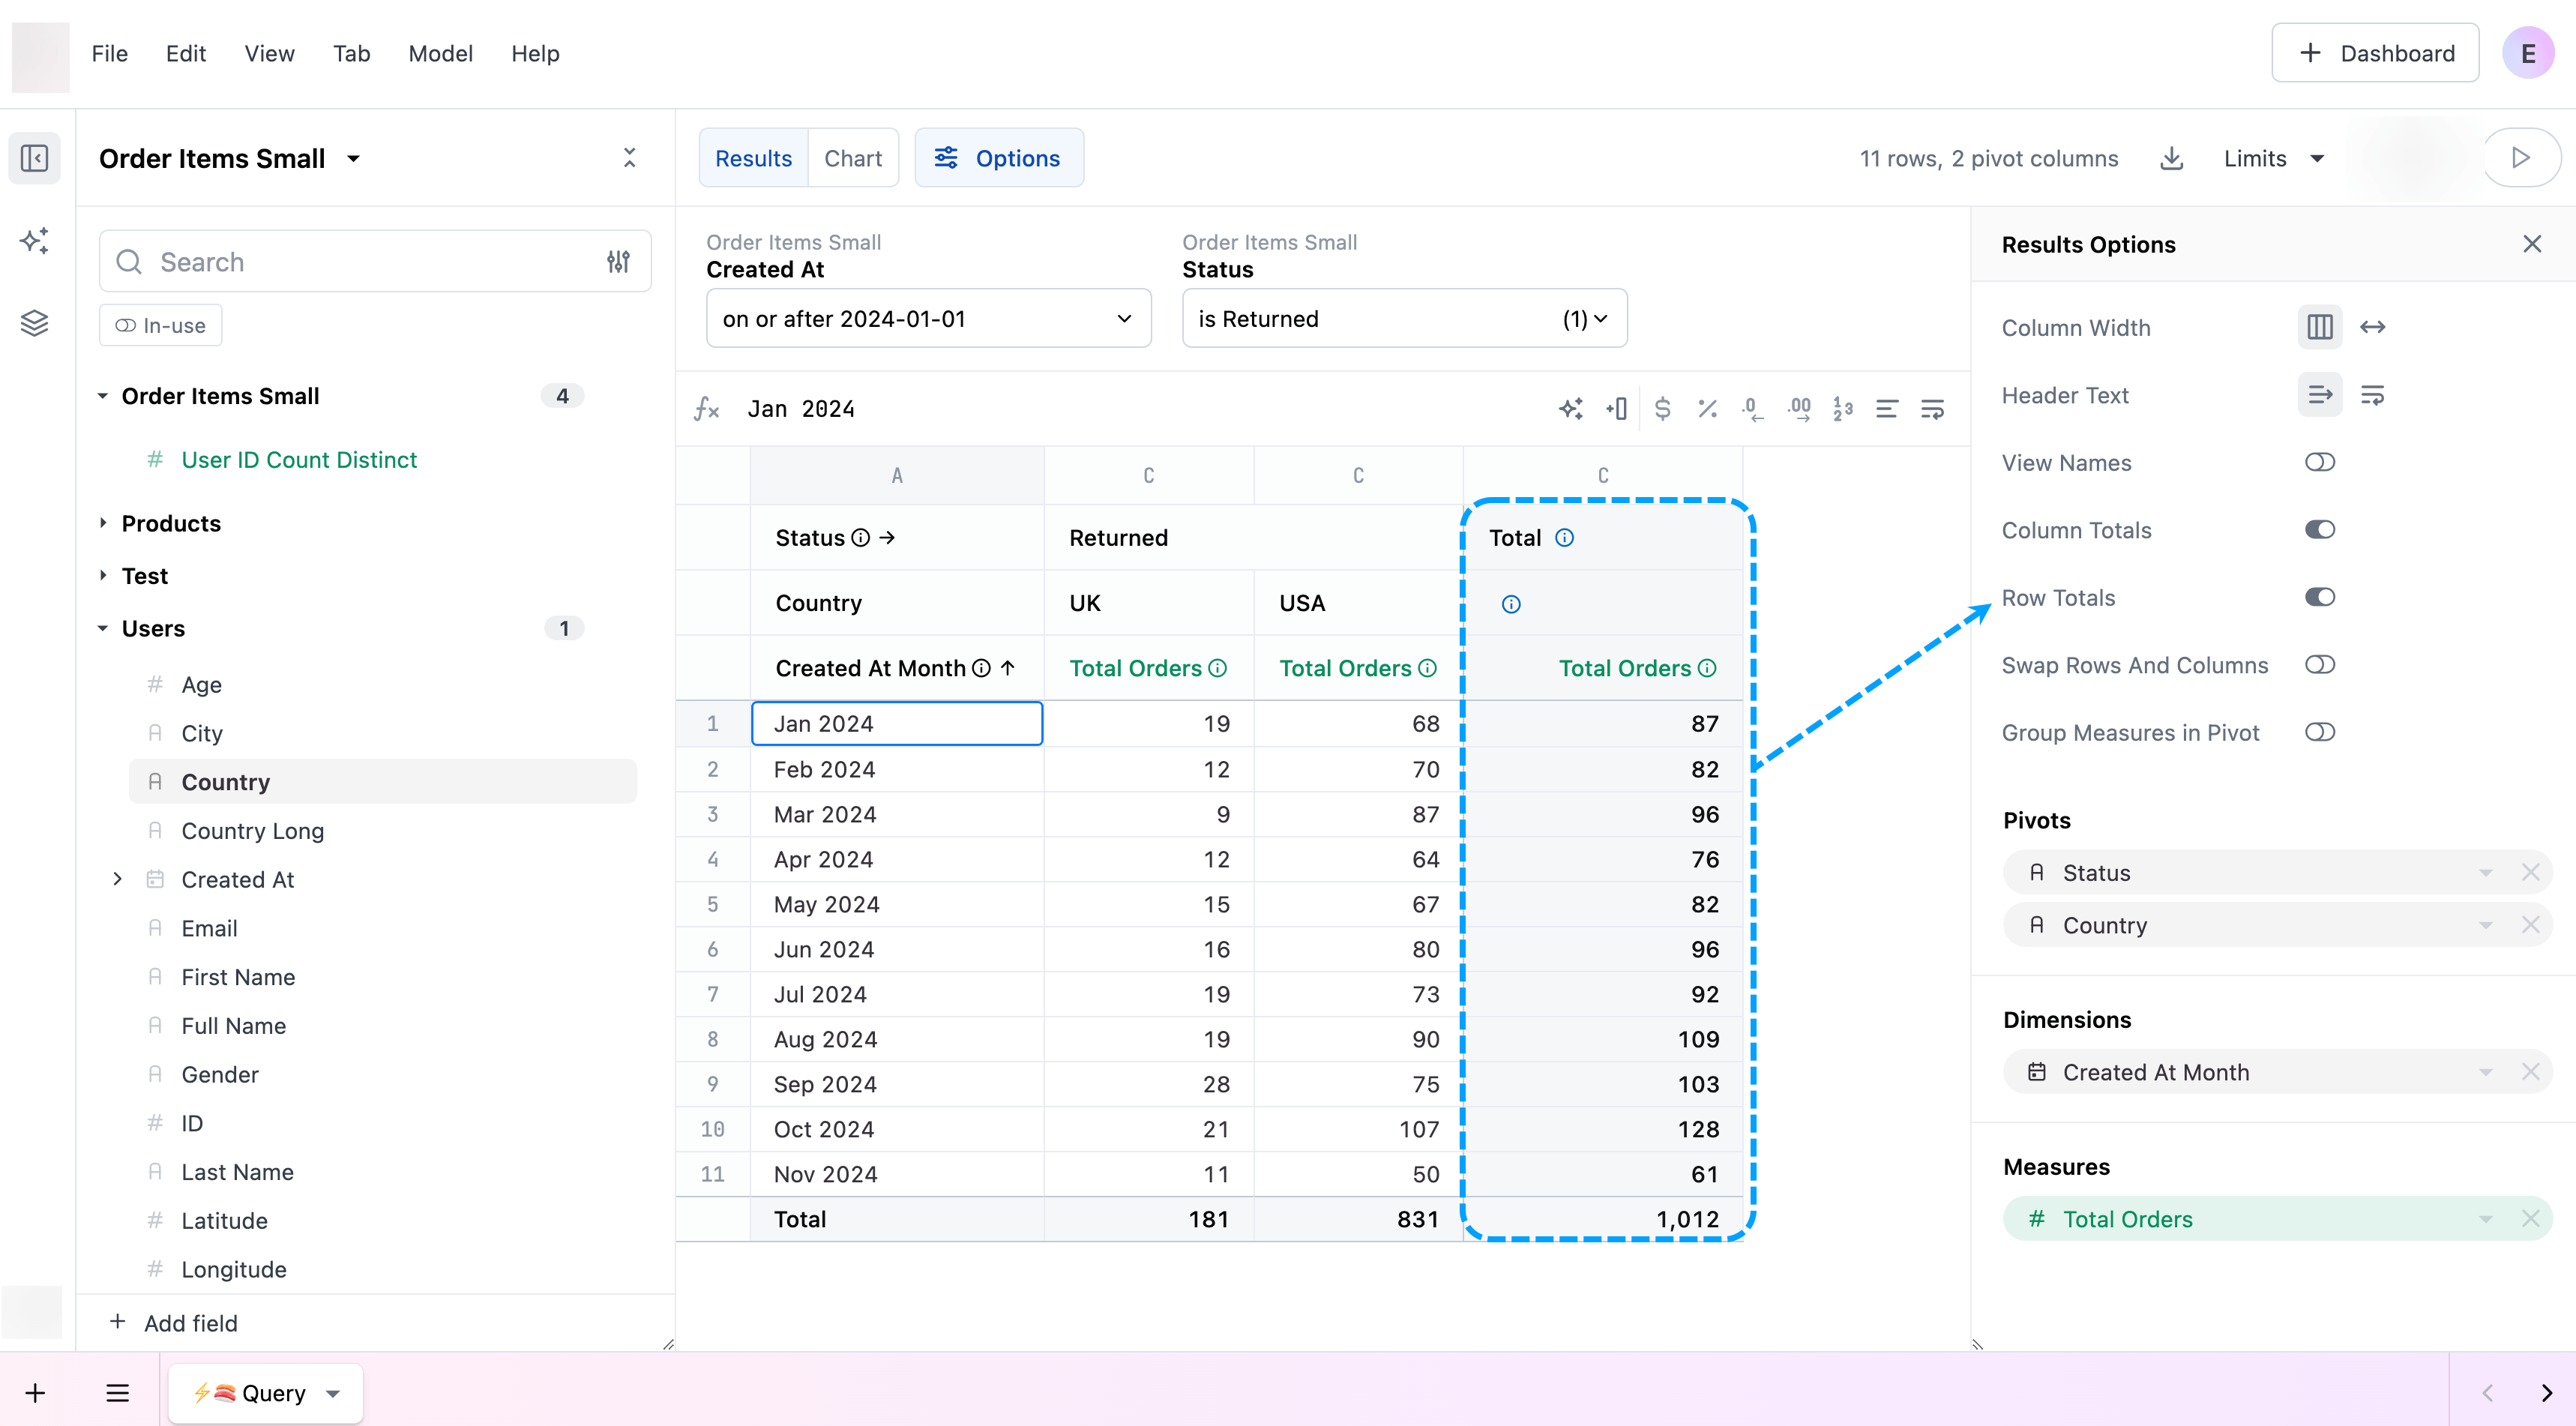
Row totals
Section titled “Row totals”Enabling row totals adds a Total column to the right of the table. For example, you have products that are sold in the UK and USA. You want to view the total number of returned orders for each country by month, but you also want to calculate the total returns for the month. Creating a pivot table like the following and enabling Row totals will add a column containing this data:
Downloading results
Section titled “Downloading results”Tab results can be downloaded as a CSV, Excel file, or JSON. Click Tab > Download or the icon to the left of the Limits menu to get started.
When configuring a download, you can set the following options:
- Format - Select the file format for the download: CSV, XLSX, or JSON
- Apply data formatting - Preserve number and date formatting in the download
- Row limit - Define the number of rows to include in the download. Options vary depending on the selected Format:
- Current limit - Apply the query’s current row limit to the downloaded results
- All possible results - Include all possible rows in the result, disregarding the query’s current row limit. For XLSX formats, this option allows downloads of up to 1 million rows.
- Custom - Specify a custom row limit for the download, which can be greater than the query’s current row limit
Removing fields and filters
Section titled “Removing fields and filters”Fields can be removed from the table either using the field picker (clicking on active fields will remove them) or right-clicking / kebab-icon-clicking in the column’s table header.
All views and fields
Section titled “All views and fields”Most querying will be done through curated topics in the UI, but at times, admins and developers may need access to the full database for ad hoc requests or in order to build new models. All Views & Fields allows those with access the ability to use the pivottable UI to query any table available for a given connection.
The dropdown above the search box offers two options to discover views:
- Views from modeled schemas
- Each schema in the database
The reason we offer both options is scalability in the data model - if we ‘model’ thousands or millions of tables in the JustAsk shared data model, there can be significant performance constraints in building the model and running queries. That said, for smaller schemas (hundreds of tables), you can comfortably model your entire data warehouse without performance considerations, and “View from modeled schemas” will simply reflect the entire warehouse. For customers with hundreds or thousands of schemas or tables, more curation in the data model will reduce clutter, and ad hoc needs across the warehouse can still be achieved through schema selection.
To ‘model’ a schema, simply touch any view in the given schema (for example, on view Users, add label: Users); this will be done through a curation process like starring in the future
For now, search will only operate inside the selected schema (or across all modeled schemas), so you may have to switch schemas to find the appropriate table if your full warehouse is not modeled. In the future, we will offer search over all schemas together in addition to schema by schema.
Example
For a customer with 2 schemas of 10 tables each, any modeling in either schema will pull the full schemas into the “Views from modeled schemas”. All Views & Fields will operate as simply one big list of all your tables
For a customer with 1000 schemas of 10 tables each, likely only 5-10 schemas may be modeled (at least to start). “Views from modeled schemas” will by default curate the list of tables to those 10 schemas, but to browser alternative schemas, select them from the dropdown.
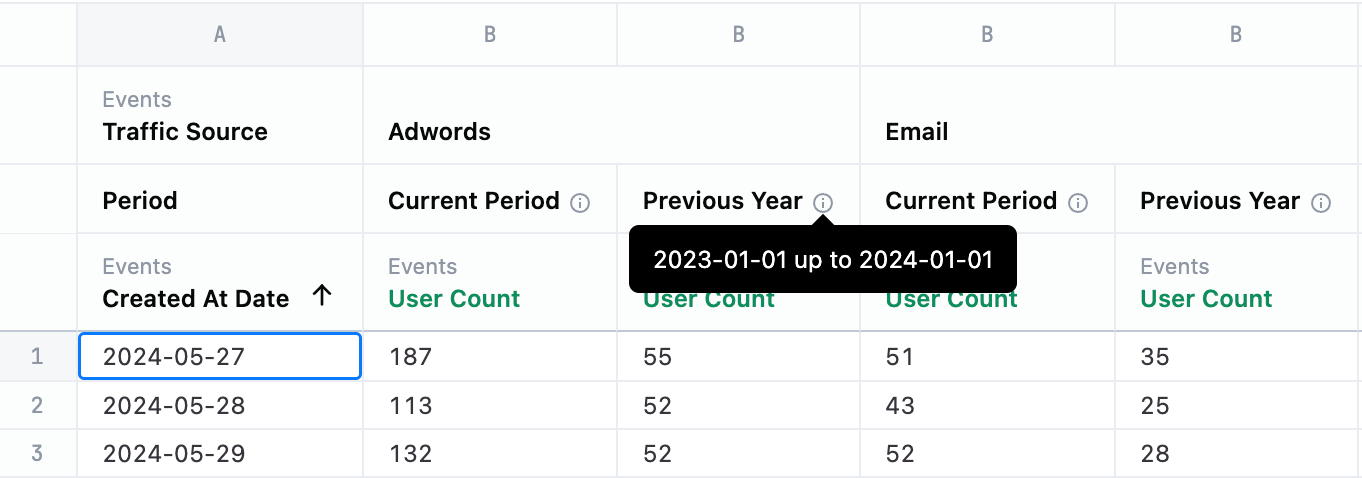
Period-over-period analysis
Section titled “Period-over-period analysis”Period-over-period (PoP) analysis is a business intelligence technique that compares metrics in a recent period to the same period in the past.
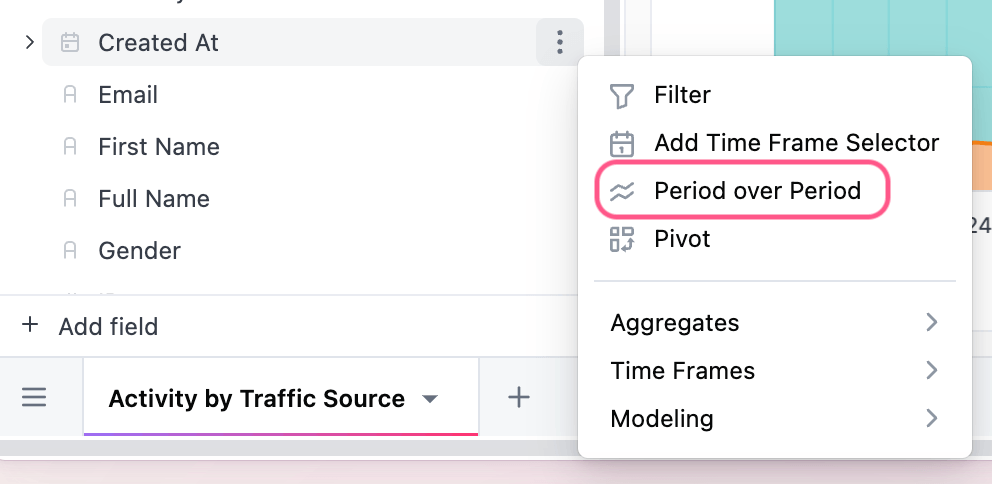
You can seamlessly create those time periods from the field picker by selecting ”Period over Period” from the three dot menu of the date dimension you want to use.
Above the results pane two drop downs will appear. In the first drop down, choose the current period and in the second drop down, the period you want to compare. The options to compare will default to relevant time frames; however you can always customize that logic.
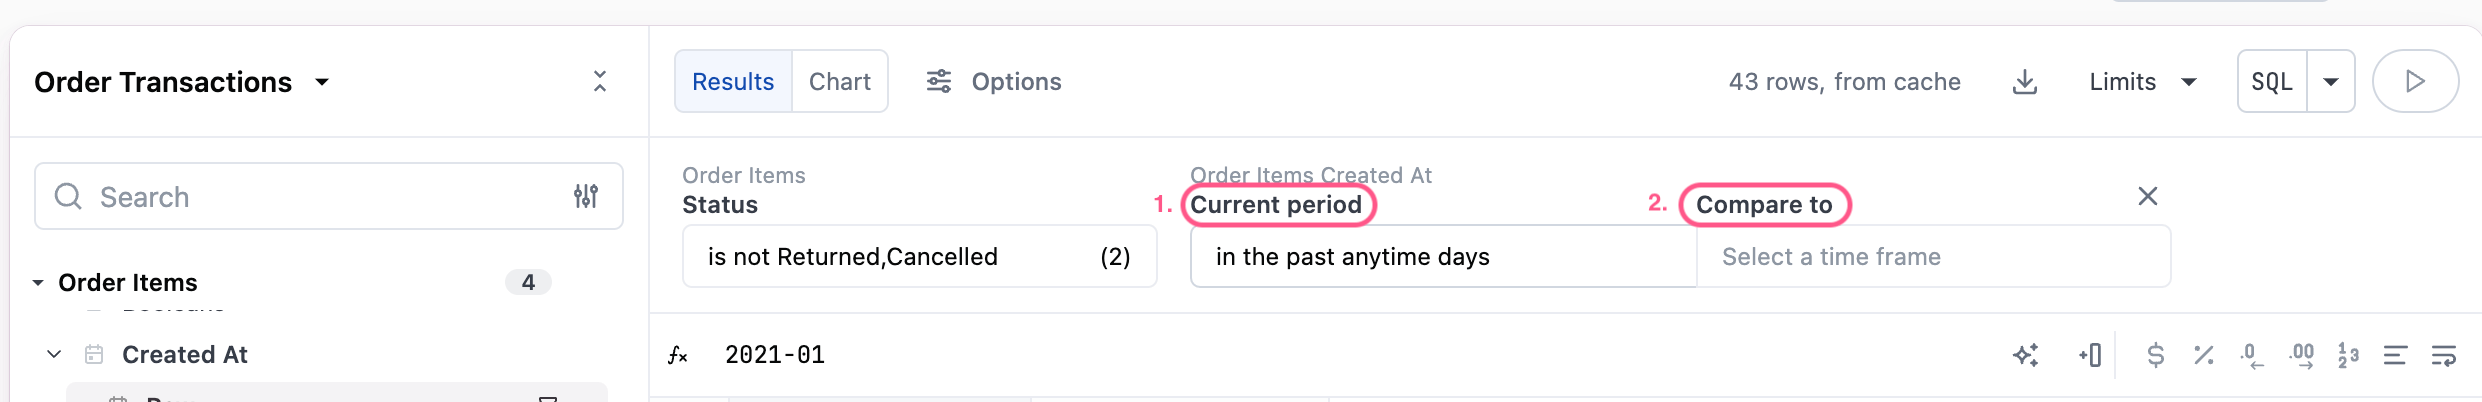
Users will be able to see more exact period parameters in the information icon on the results table.
Filling missing data
Section titled “Filling missing data”Dimension filling
Section titled “Dimension filling”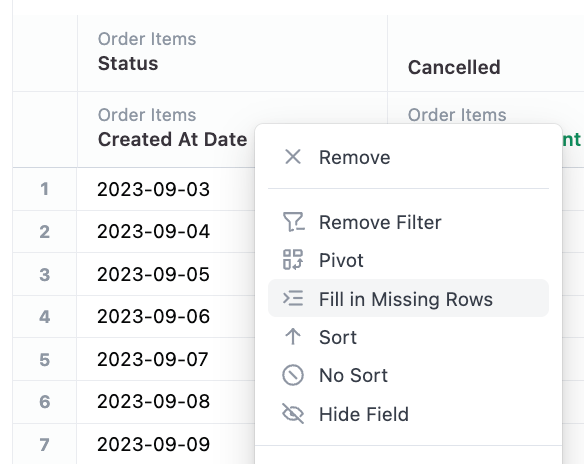
Often when querying with filters, you may return a result set that does not include every possible dimensions, for example count of sales on days with zero sales. It can be valuable to return these missing dimensions for reporting.
After querying a dimension that can be filled (ranged dates, lists), simply right click on the dimension and select ‘Fill in Missing Rows’. Note the option may not always appear on dates when JustAsk does not know the start and end date. To bring the ‘Fill in Missing Rows’ option, simply filter the date over a clear time period (ie. 2023-01-01 to 2023-02-01), which JustAsk will then fill in rows for.
In addition to dates, JustAsk can fill in missing values for enumeration fields - for now, just bins and groups defined in the data model. This may expand over time.
Note that fill is capped at 8000 values, for more complex use cases, direct SQL is recommended.
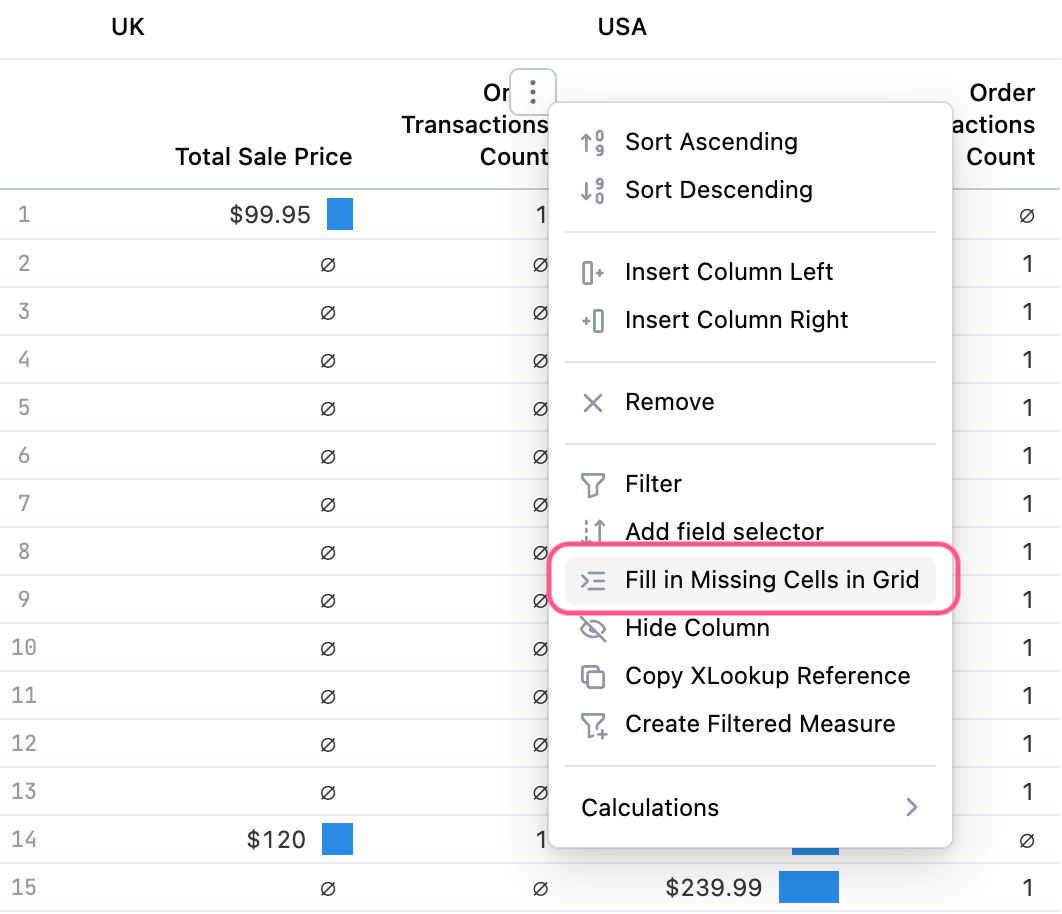
Pivoted table filling
Section titled “Pivoted table filling”In addition to filling dimensions, it’s often valuable to fill a pivoted table that contains nulls for ‘more correct’ reporting of aggregates. To replace nulls with 0s in the pivottable, simply select “Fill in Missing Cells in Grid” on a pivoted report:
Adding controls
Section titled “Adding controls”Controls allow a user to swap out one field for another on a query making it more dynamic. There are three main types of controls:
- Time
- Field
- Parent
Time controls
Section titled “Time controls”These controls will allow you to swap the time frame within the underlying query. This provides an easy UI based mechanism to swap from daily to weekly to monthly and back again, all without any underlying work needing to be done to facilitate it from an administrative perspective. A time frame control can be added from either the field picker or from the date field in the results table by choosing Add Time Frame Selector from the three dot menu.
In order to create a control for dimensions or measures, first add one to the query and switch to the Results view. From there, select the three dot menu on the column and Add field selector. A control will appear above the table with a three dot menu for a user to edit the control (change the label, add additional fields, or add a parent control).
Once there are two or more options in the control, a user can select the field they want represented in the table or visualization and dynamically toggle among the options.
Parent controls
Section titled “Parent controls”These controls will allow you to coordinate the toggling of multiple controls at once from a single point and click UI. From any existing control, select the option Add parent control. A control will appear above the table, select the three dot menu to edit the control. First add options that will appear in the drop down, then assign the child controls that will be chosen based on the option selected in the parent control.