Working with dashboard filters
JustAsk supports two types of dashboard filters:
- Advanced: the default filters which allow users to select multiple options
- Single select: a filter control that only allows the user to put in one option into the filter. If using Advanced layouts, you can display single select string filters as clickable buttons.
Creating dashboard filters
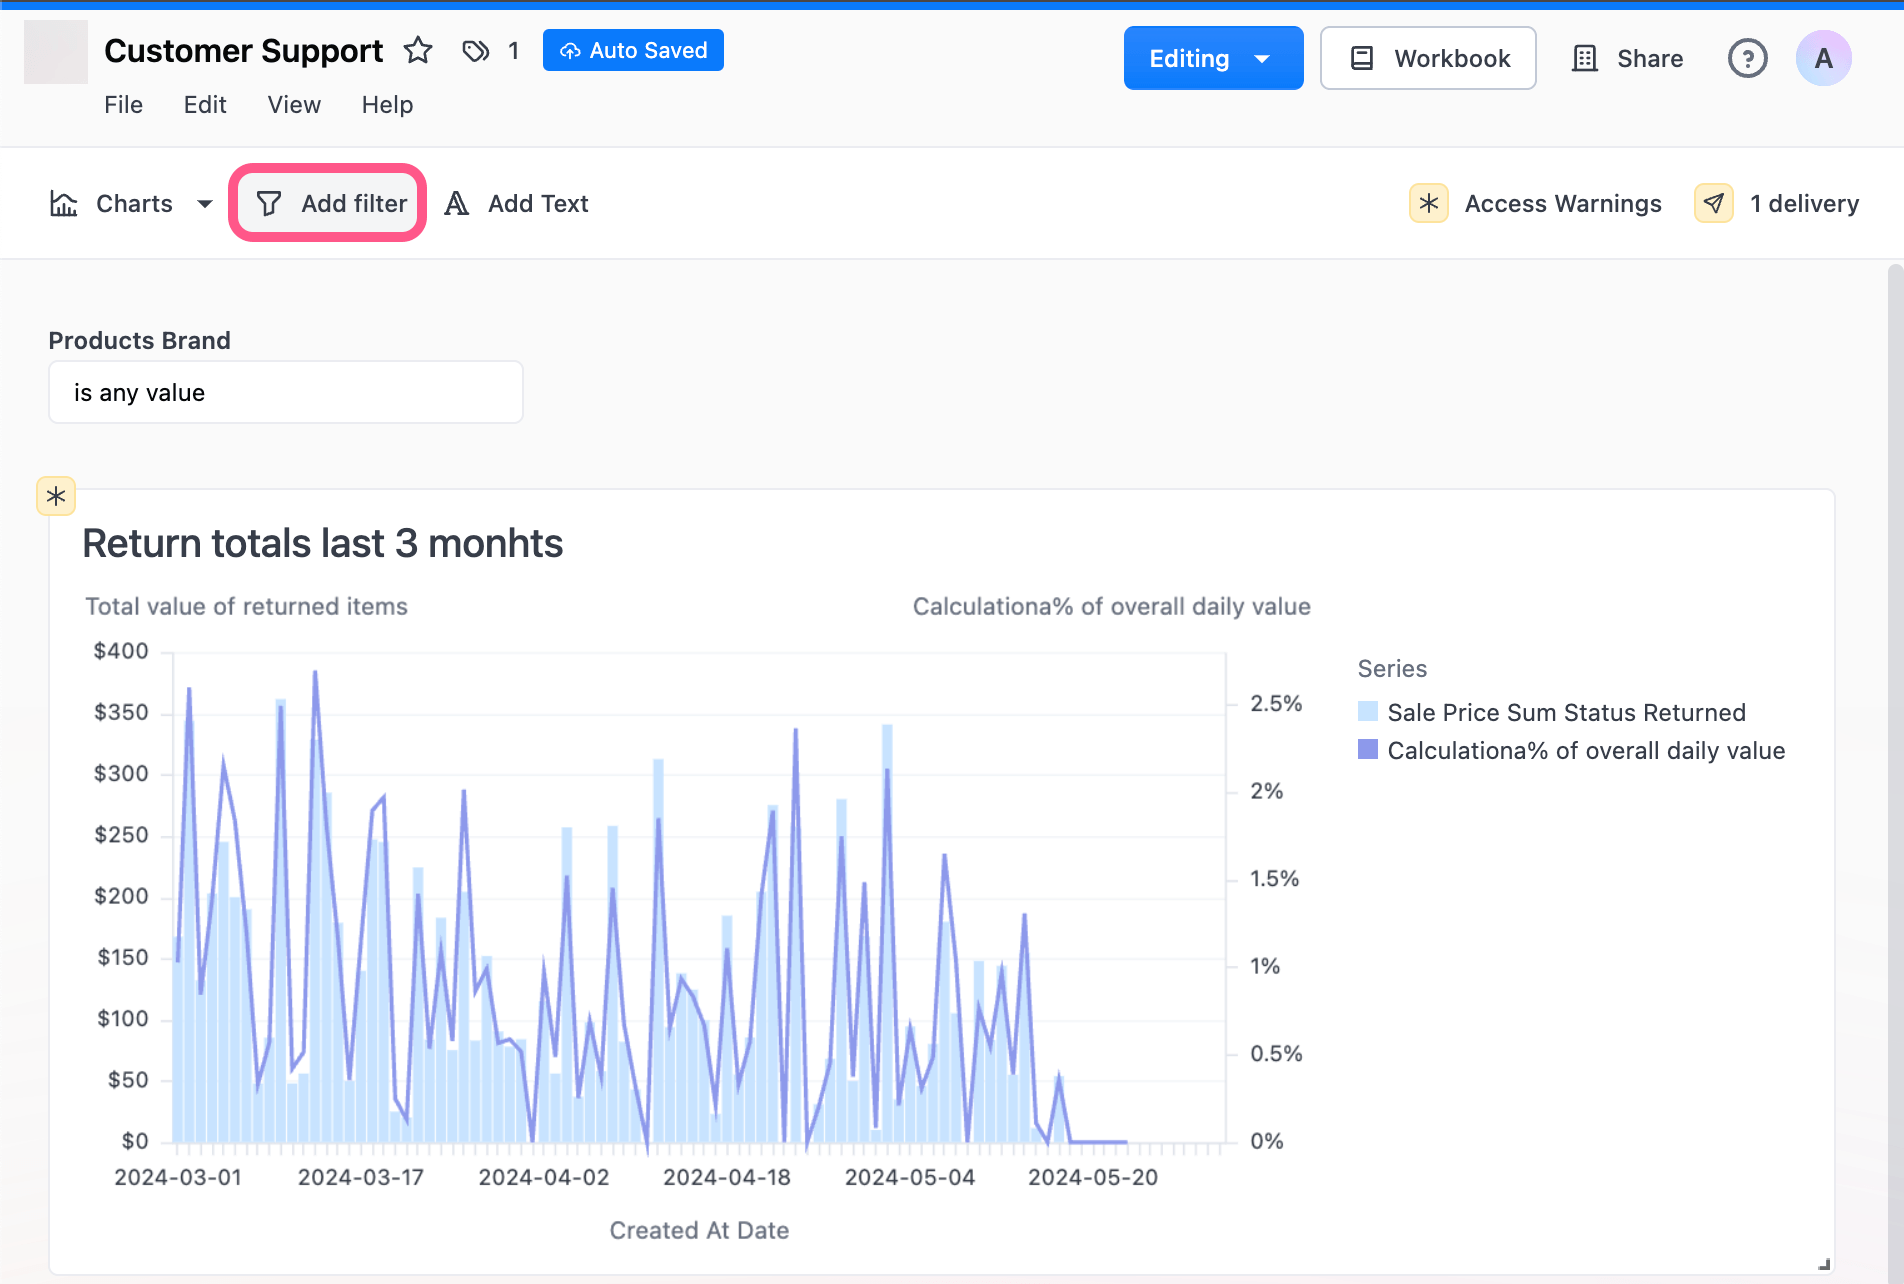
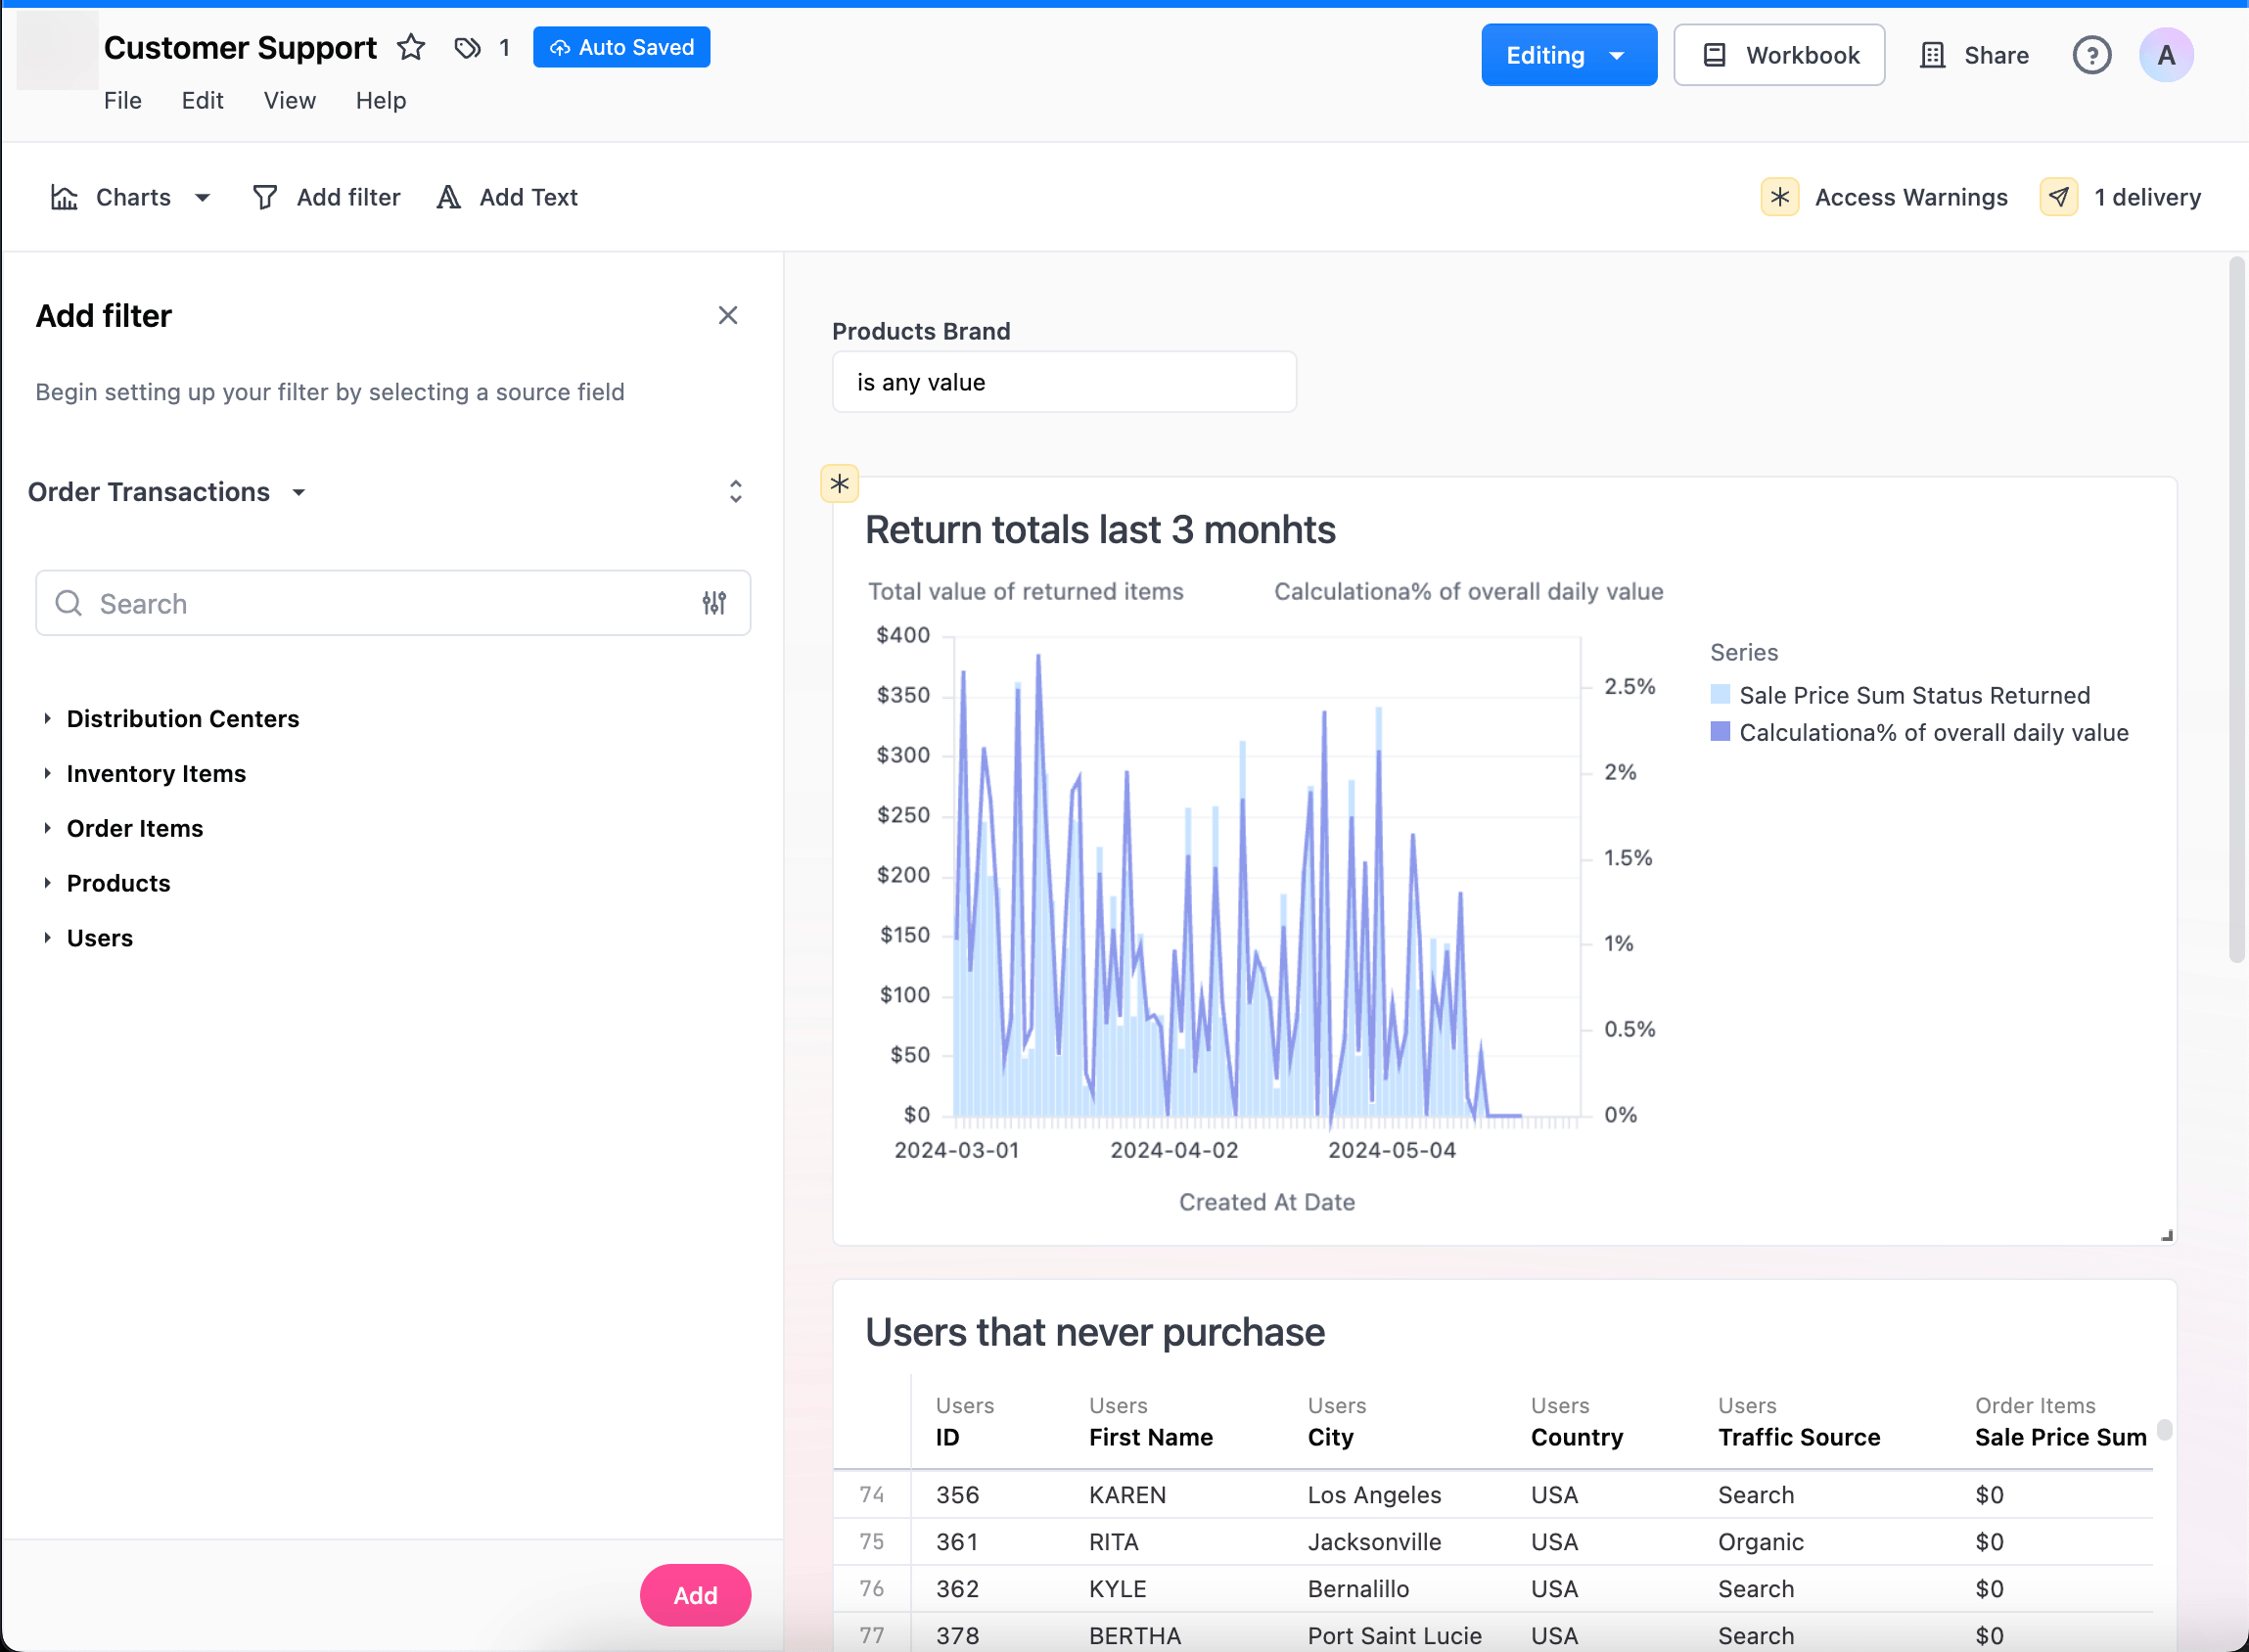
Section titled “Creating dashboard filters”To add a filter to the dashboard, enter edit mode and click Add > Filter in the toolbar. Choose the field you want to base your filter on. The field you choose as your filter base will determine:
- where suggested filter values come from
- determine which field on your dashboard tiles JustAsk will automatically map to initially (can be edited)
- the type of field the dashboard filter can be applied to (i.e string, numeric, date)
If you do not see options in the dropdown when connecting a filter to a chart, make sure the types match. E.g. If your filter is based on a string field you will only see options to apply to filter to fields of the same type. If a field is unknown, it will not know how to map it and display no matches as well.
Adding descriptions
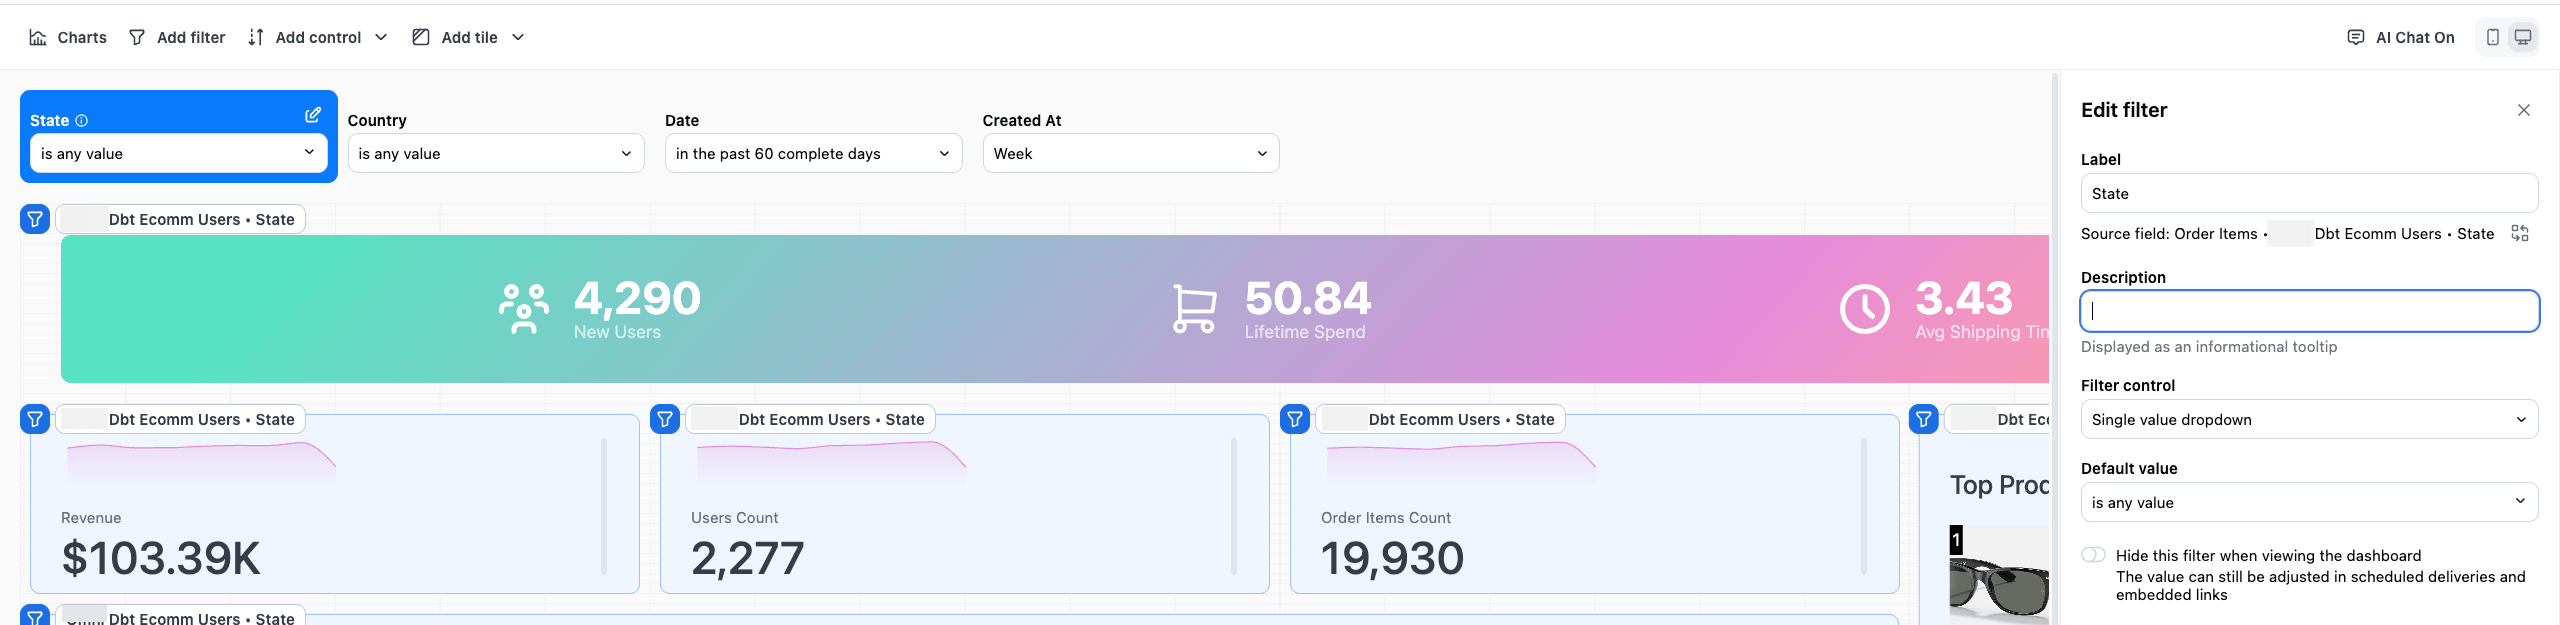
Section titled “Adding descriptions”Use the Description field in the filter details panel to add a description. To edit an existing filter, click the (pencil icon) next to a filter:
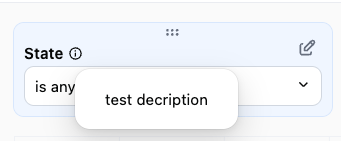
When a filter has a description, a (info) icon will display next to the filter name. Hover over the icon to view the description:
Setting default values
Section titled “Setting default values”If you want to set a default value for the filter, you need to configure the values in the left pane during edit mode (note that filters done in the page in edit mode will not change the default filter experience). This value will be pre-loaded anytime the Dashboard is opened. Filters can be disconnected from specific dashboard tiles by clicking the blue filter button in the top right corner of a tile. Dashboard filters will override any workbook level filters that exist on the field they are applied to.
If a tile is hidden, but still needs to have the filter applied, first un-hide the tile, then add the filter, and then re-hide the tile.
Filtering with user attributes
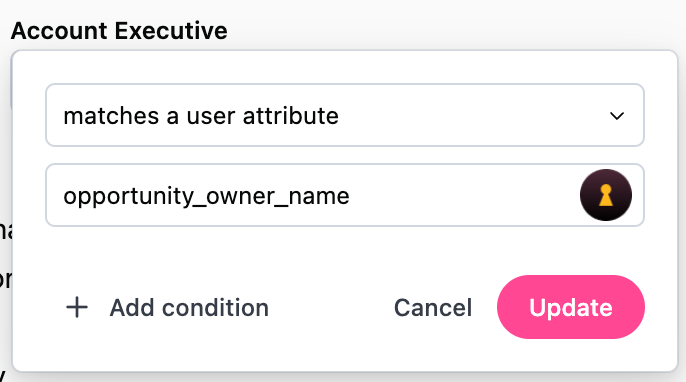
Section titled “Filtering with user attributes”Filter values can be set to a user attribute so that the default filter value changes based on the user accessing the content. This is useful for when you want to create a single dashboard and have it dynamically filter the information to the end user. One example is a sales dashboard with a filter set to an attribute on Account Executives name, so when that user views the dashboard it is automatically narrowed to their own deals.
Disabling filters on chart tiles
Section titled “Disabling filters on chart tiles”Filters can be disabled from filtering different tiles on the dashboard. When editing a filter, select the filter icon in the upper right of each tile to disable the filter for that tile.
Hiding filters
Section titled “Hiding filters”To hide a filter, toggle the Hide this filter when viewing the dashboard to on. The filter value will still be applied to the tiles that use the filter. The value of the filter can also be manipulated via the dashboard’s URL, but ultimately the control is hidden from the user.
Hiding dashboard filters may seem like a quick fix for restricting user access to sensitive data, but it’s not a foolproof security measure. For robust data access control, work with your data team to implement access filters in the model.
Mapping filters to differing fields on tiles
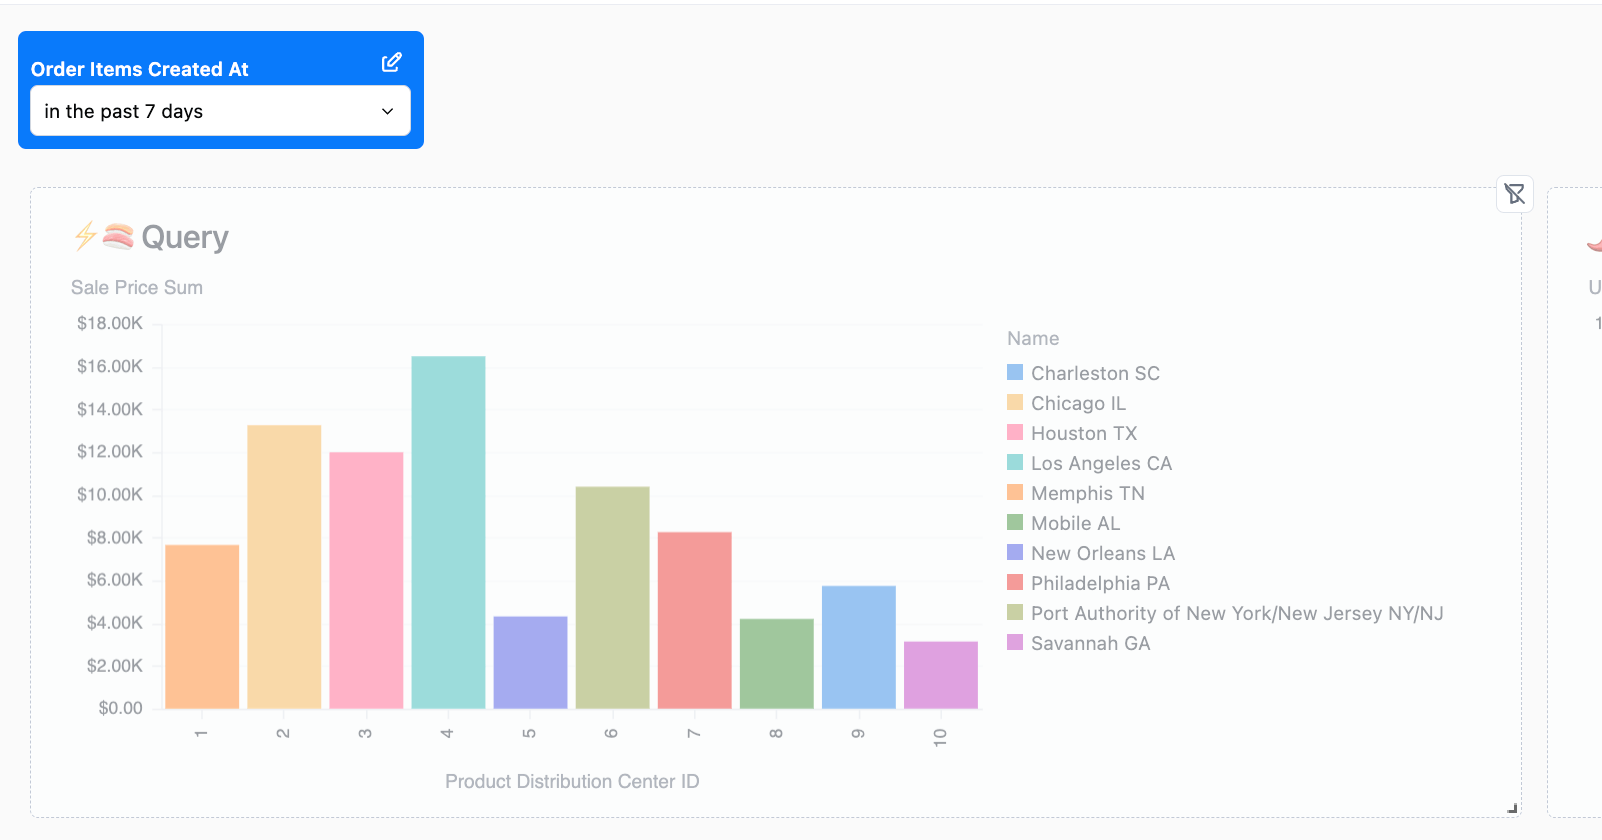
Section titled “Mapping filters to differing fields on tiles”Filters can optionally be mapped to different fields on each tile. A common example is when you have a dashboard date filter, but want it to update a different date field on each tile (e.g. the users tile uses user_created_at and the orders tile uses orders_created_at). To configure, edit the filter then on the top right of each tile, select the field you want to map the filter to.
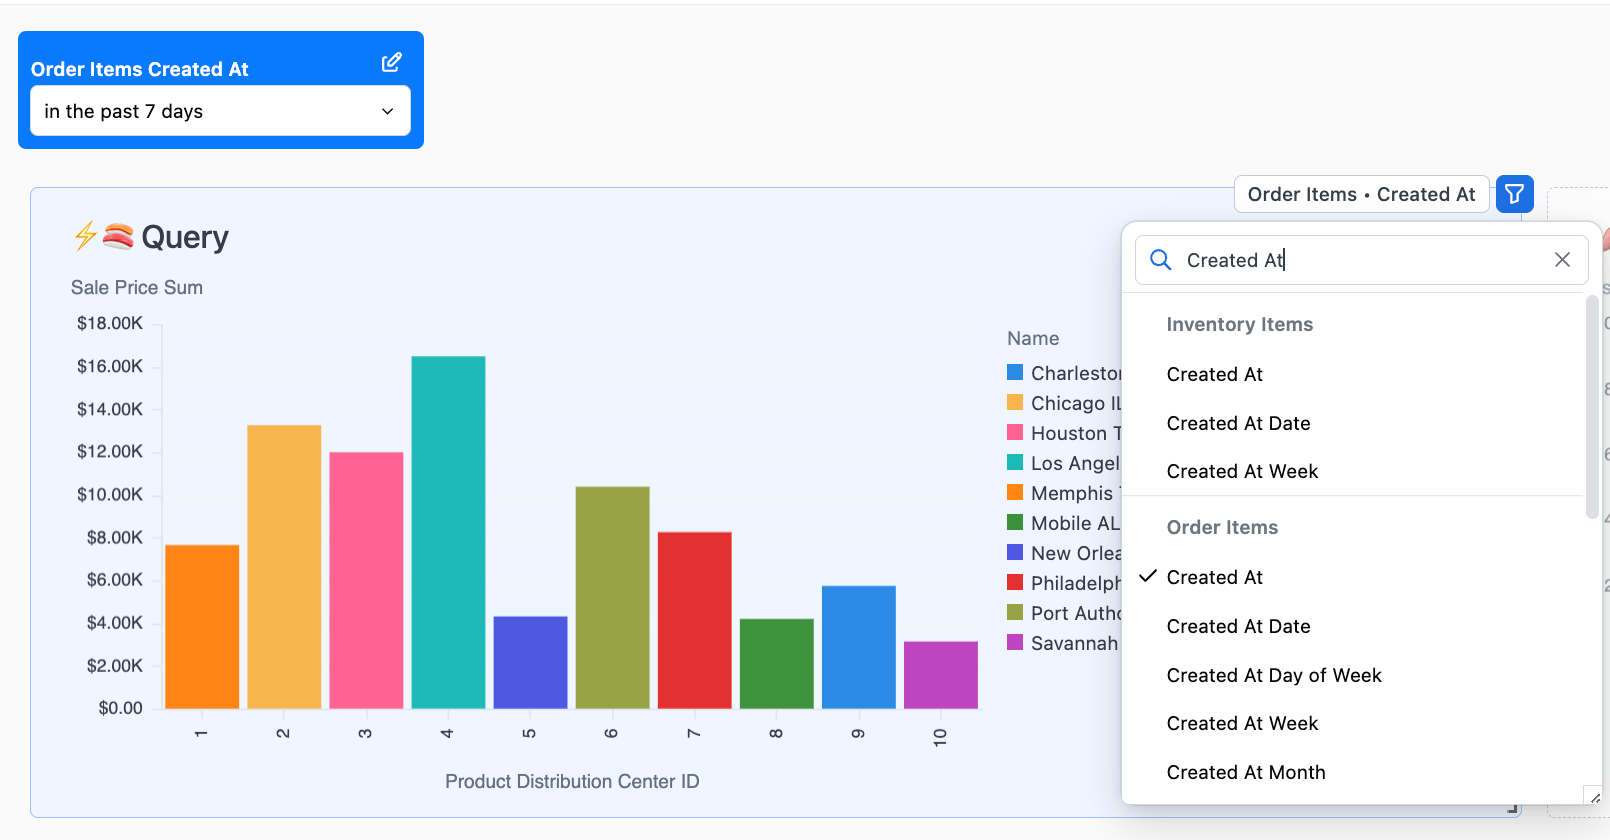
When mapping filters, the available fields on any given tile will reflect available fields of the same type as the filter source field. If you are mapping to a tile built from a topic you will only be able to map to fields of the same type within that tiles’ topic.
Mapping filters to calculations
Section titled “Mapping filters to calculations”In addition to view fields, you can also map dashboard filters to calculations defined in a tile’s query. When editing a filter and selecting the field mapping for a tile, calculations appear in a separate Calculations group in the dropdown menu. This allows you to apply dashboard filters to custom calculations without needing to define them as fields in your model.
Faceted filters
Section titled “Faceted filters”Faceted filters automatically link filters so that one filter will limit the results of another. For instance a state filter will reduce the city options to only cities that are in that state.
Faceted filters are disabled by default. You can enable them in the dashboard’s settings.
Cross-filtering
Section titled “Cross-filtering”Dashboard cross-filtering enables you to interactively filter an entire dashboard by clicking on chart elements. When you click on a data point, bar, or other chart element, you’ll have the option to create a filter that applies across all compatible tiles on the dashboard.
Cross-filtering is available for the following visualization types:
- Vega-Lite charts (bar, line, area, scatter, heatmap)
- Pie and donut charts
- Maps (choropleth and point maps)
- Data tables
- Sankey
Cross-filters apply to any tile that has a joinable relationship to the filtered field through the semantic model. When you click a cross-filter chip, tiles that can’t be filtered are visually dimmed and display a badge indicating why.
Enabling cross-filters
Section titled “Enabling cross-filters”Cross-filters are turned off by default. You can enable this feature in the dashboard’s settings.
Limitations
Section titled “Limitations”Cross-filtering has the following limitations:
- Cross-filters don’t apply to null values
Additionally, some tile types are not supported:
- Linked tiles — tiles sourced from a separate workbook tab have their own independent query and can’t receive cross-filters
- Raw SQL tiles — SQL-mode tiles can only be cross-filtered if they include a templated filter (
{}) for the relevant field
Creating and using cross-filters
Section titled “Creating and using cross-filters”Cross-filtering allows you to explore your data dynamically by selecting values directly from your visualizations. There are several ways to create cross-filters:
- Click-to-filter - Click on any chart element to filter the entire dashboard by the selected value.
- Brush selection - On charts with continuous axes (time series or numeric charts), you can click and drag to select a range of values. This creates a range filter that applies to all compatible tiles on the dashboard.
- Multi-select - After creating a cross-filter on a discrete field, you can use
Cmd + ClickorCtrl + Clickto select additional values. This allows you to filter by multiple values for the same field.
Removing cross-filters
Section titled “Removing cross-filters”When you apply a cross-filter, a dismissable chip appears below the dashboard filters showing the active cross-filter. Click the on the chip to remove the cross-filter.
Highlighting and dimming
Section titled “Highlighting and dimming”When you click on an active cross-filter chip, JustAsk highlights the source tile where the cross-filter originated and dims tiles that can’t be filtered by that field. This helps you understand which tiles are affected by each cross-filter.