AI summary visualization
Requirements
Section titled “Requirements”To use this visualization type, you’ll need:
- A query built on topic data
- The AI Visualization Summary setting enabled. This is enabled by default.
Building the query
Section titled “Building the query”To get the best results in the summary, keep the following in mind when building the underlying query:
- Avoid pivoting or swapping rows/columns in the query. This significantly reduces the context window, leaving little available for the actual data.
- Include calculations and totals in the query if you want the summary to reference them. This approach will provide better results over relying on the AI for calculations in the summary itself.
Adding context
Section titled “Adding context”You can provide additional context in the chart’s Options to guide the AI in generating the summary.
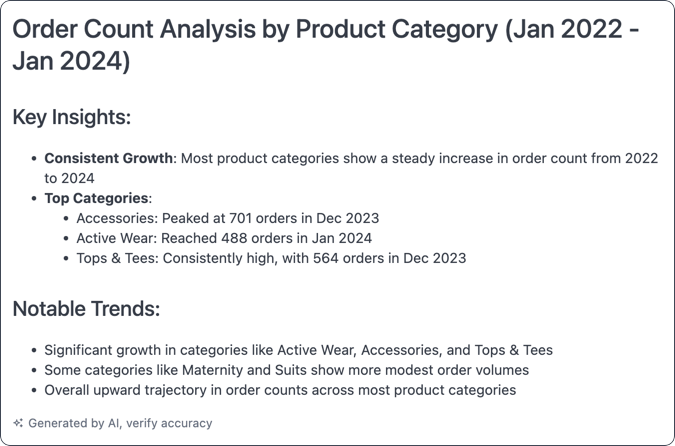
Example: Specific audience and content
Section titled “Example: Specific audience and content”This example was given this context: Explain it to me like I am a ceo and give me 3 followup questions

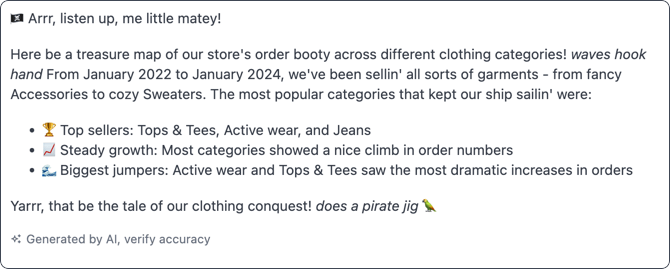
Example: Specific tone
Section titled “Example: Specific tone”You can provide context to the AI that specifies the tone of the summary. For example, Explain it to me like I am 5 in a pirate voice